Comparison of sleep, fatigue and burnout in Post-Graduate Year 1 (PGY1) residents and faculty members – A prospective cohort study

Published online: 2 May, TAPS 2017, 2(2), 1-7
DOI: https://doi.org/10.29060/TAPS.2017-2-2/OA1012
Mae Yue Tan1, Jia Ming Low1, Kay Choong See2 & Marion M Aw1,3
1Khoo Teck Puat-National University Children’s Medical Institute, National University Health System, Singapore; 2University Medicine Cluster, National University Hospital, Singapore; 3Department of Paediatrics, Yong Loo Lin School of Medicine, National University of Singapore, Singapore
Abstract
Aim: We aimed to combine self-report measures with physiological measures (using a wrist actigraph) to compare and quantify the difference in activity levels, sleep, fatigue and professional quality of life between residents and faculty.
Methods: All year 1 post-graduate (PGY1) residents and faculty were invited to participate. Participants were required to wear a wrist actigraph for four months, and complete two validated surveys (i.e. Epworth Sleepiness Scale(ESS) and the Professional Quality of Life(ProQoL)) once each at the start and again at the end of the study.
Results: Forty-nine PGY1 residents and eleven faculty participated. Residents logged less sleep in a working day than faculty, with median (range) of 356 (114-630) minutes versus 393 (162-704) minutes (p=0.001). Residents had decreased sleep latency, with a shorter median time to fall asleep (6 versus 7 minutes) (p=0.001). Residents walked more, with median (range) daily steps of 10207.5 (280-26638) versus 8155 (481-31236) (p=0.001). At study start and end, residents (61.5%, 69.2%) and faculty (30%, 44.4%) both reported ESS>10, suggestive of excessive daytime sleepiness (p>0.05). Residents reported higher burnout scores compared to faculty; 34.9% versus 0% (p=0.024) and 23.1% versus 0% (p=0.304), and lower compassion satisfaction scores; 25.6 vs 0% (p=0.095), 37% versus 0% (p=0.039), for both time points.
Conclusion: Although faculty sleep more than PGY1 residents, they are similarly at risk of fatigue. However, faculty experience lower burnout and higher compassion satisfaction scores. Whilst lack of sleep and fatigue can contribute to burnout, faculty likely possess protective mechanisms, which residents have yet to acquire.
Keywords: Sleep; Activity; Fatigue; Burnout; Actigraph
Practice Highlights
- PGY1 residents are at risk of greater fatigue, burnout and experience less compassion satisfaction compared to faculty members.
- Fatigue is inevitable in the medical profession. Measures need to be taken and life skills taught to help junior doctors cope with the rigours of work and training, that faculty may have acquired over time.
- Future studies can be done to explore if teaching these strategies early would be beneficial to junior doctors.
I. INTRODUCTION
The training years of a doctor are a stressful period during which one has to work long hours, hold huge responsibilities in the workplace yet has relatively little control over. This is likely experienced for the first time during the first post-graduate year (PGY1) as a doctor. It is a perceived notion that senior doctors are less fatigued than junior residents in the hospital as they have shorter work hours, do not do first-line ward work and do not usually do stay-in calls. Ward work includes interviewing and examining newly admitted patients, creating admission histories, writing admission orders, performing phlebotomy services, following-up on laboratory results, reporting interim updates to their supervising resident and doing discharge summaries. These duties are physically laborious resulting in longer work hours and potentially less sleep time. We hypothesized that the nature of such duties for PGY1 doctors are linked to increased reports of fatigue and burnout.
We know that fatigue and burnout have detrimental effects on residents, and there might be long-lasting implications on their physical and mental well being (Lourenção, Moscardini, & Soler, 2010; Fletcher, Reed, & Arora, 2009). An observational analysis by Lee et al suggested that increased night duty loading of physicians caused elevated blood pressure and sympathetic tones in a dose-dependent manner (Lee et al., 2016). Studies have reported increased somatic complaints, depression and increased physical dangers in residents who are more fatigued (Veasey, Rosen, Barzansky, Rosen, & Owens, 2002).
An article published in the Annals Academy of Medicine Singapore reported that junior doctors have lower health-related quality of life scores compared to senior doctors (Tong, Tin, Tan, & Lim, 2012). This paper aims to study difference in activity levels, sleep, fatigue and professional quality of life between residents and faculty. Apart from this article, there are no known local data comparing degree of fatigue and burnout between faculty and residents.
Our study aims to combine self-report measures with physiological measures (using a wrist actigraph) to compare and quantify the difference in activity levels, sleep, fatigue and professional quality of life between residents and faculty.
II. METHODOLOGY
A. Participants
All PGY1 residents in the institution were invited to participate. They could be rotating in any of these departments: Medicine, Paediatrics, Orthopaedics, Obstetrics and Gynaecology and Surgery. All the faculty members were recruited from either the Medicine or Paediatric department, who were at least junior consultant and above in rank. Participants were asked if they had known medical conditions. Exclusion criteria were doctors with psychiatric, sleep disorders or cardiac problems. Target recruitment was 60 PGY1 residents, and 20 faculty members. At our institution, work hours for all junior doctors, are governed by ACGME-I (Accreditation Council of Graduate Medical Education- International) duty hour requirements. Depending on which department residents are posted to, they work an on-call rota (approximately 4-6 on-calls per month), or work 5 nights a week on the night float system (approximately once every 2 months). Despite being in different departments and having different on-call schedules, the job scopes for every PGY1 resident are similar as they involve ward work. Faculty members participate in clinical work, education, as well as administrative work in the department. They predominantly do stay-home on-calls.
B. Instruments Used
The study comprised of two components; (1) Wearing a wrist actigraph for a continuous period of four months. (2) Completing two questionnaire surveys; the Epworth Sleepiness Scale (ESS) and the Professional Quality of Life (ProQoL), once each at the start and again at the end of the study. These two surveys were repeated at the start and end of the study. The wrist actigraph (Martin & Hakim, 2011) (FitBit) is a validated alternative to polysomnography for detecting sleep and estimating sleep duration and activity level. Actigraphy (Takacs et al., 2014) uses a single channel that collects data on movement, which is used to infer time spent asleep and awake. It was chosen as a study tool to collect sleep and activity data in our residents as it is less cumbersome than polysomnography, less expensive and can be worn for extended periods of time.
The ProQoL instrument (Proqol, 2016), initially created for therapists, nurses, and humanitarian workers, is a widely used tool to assess positive and negative aspects of caring. It comprises of the positive (Compassion Satisfaction) and the negative (Compassion Fatigue or Secondary Trauma Stress) aspects of helping others who have experienced suffering. Compassion Satisfaction is defined as the pleasure derived from being able to do one’s work well. Higher scores on this subscale represent greater satisfaction with one’s ability to be an effective caregiver. The Compassion Fatigue or Secondary Trauma Stress subscale measures work related secondary exposure to extremely stressful events and higher scores represent greater Compassion Fatigue. The three aspects of the ProQol were scored based on cutoff scores as per the validated scoring, and analysed as categorical data. Compassion Satisfaction scores of ≥ (more or equal to) 57 were defined as low (lower positive aspects of working as a helper), Burnout scores of ≥ 57 were defined high (inefficiency and feeling overwhelmed), and Traumatic scores of ≥ 57 were considered high.
The Epworth Sleep Study Scale (ESS, Epworth sleepiness scale, 2016) is a self-administered questionnaire with eight questions. It provides a measure of a person’s general level of daytime sleepiness, or their average sleep propensity in daily life. This simple questionnaire has been validated and has shown reliability as a measure of daytime sleepiness. In the ESS questionnaire, scores of >10 suggest increased daytime sleepiness. Day time sleepiness is defined as a subjective report of difficulty in maintaining the alert awake state, usually accompanied by a rapid entrance into sleep when the person is sedentary (Thorpy, 2012). While sleepiness and fatigue are not synonymous, excessive daytime sleepiness contributes significantly to the feeling of fatigue (Lavidor, Weller, & Babkoff, 2003). We defined severe sleepiness as sleep episodes that are present daily and at times of physical activities that require mild to moderate attention, and this degree of sleepiness is usually associated with mean sleep latency of less than 5 minutes (Mansukhani, Kolla, & Ramar, 2014).
C. Procedure
The National University of Singapore (NUS) Institutional Review Board approved this study. Information about the study was presented to PGY1 residents across all departments during their weekly continuing medical education sessions over four weeks prior to the launch of the study. Posters were placed in the resident’s lounge and lift lobbies around the hospital to recruit residents. Participants provided voluntary written informed consent. Participants were allowed to keep the wrist actigraph on completion of the study.
Study participants were instructed to wear the wrist actigraph on their non-dominant hand for 24 hours per day throughout the study period. The wrist actigraph data were downloaded weekly or every fortnightly into an actigraphy-based scoring software program (Detalytics integrated biometric analytics) which enables calculations of sleep duration, sleep latency (time taken to fall asleep) and sleep efficiency (at least 85% of non-restless sleep). Sleep efficiency is the ratio of total time spent asleep (total sleep time) in an evening to the total amount of time spent in bed (Thorpy, 2012).
D. Data analysis
Data was analyzed using SPSS software. The Mann Whitney test was used for continuous data (e.g number of steps, minutes of vigorous/moderate activity) where there was a non-normal distribution. (Figure 1). This non-parametric test was also chosen because of the disparity between the sample sizes of PGY1 and Faculty group suggesting that the variances between groups to be heterogeneous (hence violating the homogeneity of variance assumption that ANOVA requires).
The chi-square test was used for categorical data (e.g ESS scores, and ProQoL scores were categorically split based on the defined cut-offs). We chose these methods of comparison to compare the activity and sleep between the two groups, and then determining whether these differences in activity and sleep had any trends with the ESS and ProQoL.
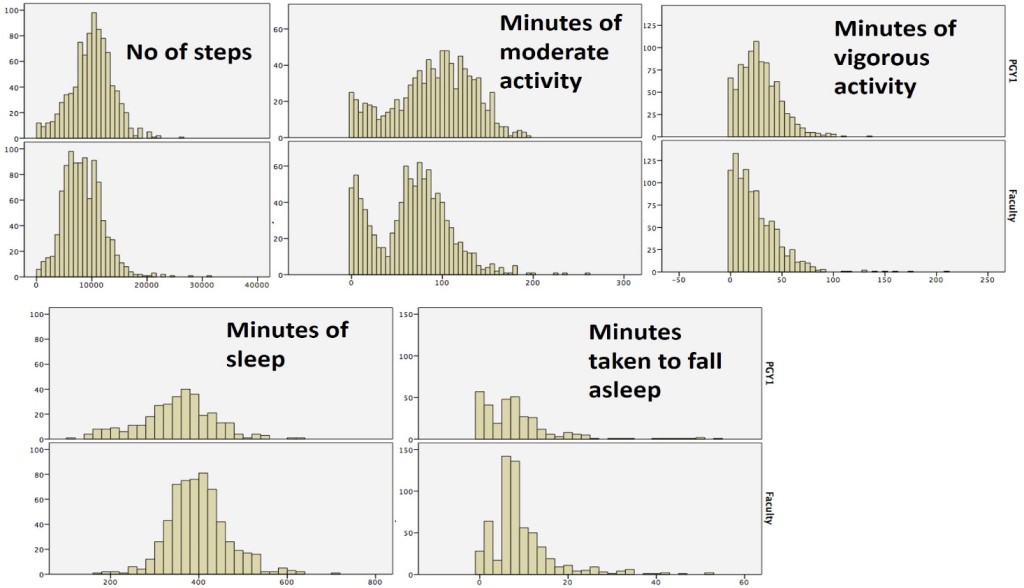
PGY1= Post-Graduate Year 1
Figure 1. Histograms showing data distribution for continuous data collect between the two groups.
III. RESULTS
Forty-nine residents and eleven faculty members were recruited. The study was of a 4 month-period, from 1st January 2015 through 30th April 2015. A higher percentage of faculty members (91%) had complete actigraph data throughout the 4-month study duration compared to residents (Table 1a). Of the 49 residents, 22.4% had complete data, and an additional 46.9% had partial data. About 30.6% of residents had less than 1 month worth of data logs from the actigraph device. The response rate for the surveys at both time points of the study are shown in Table 1b. Baseline characteristics of the residents who had complete or partial/incomplete data are shown in Table 2.
| Group | Total | Complete
(4 months of data) |
Partial
(at least 1 month data) |
No data/less than 1 month |
| PGY 1(%of total) | 49 | 11 (22.4%) | 23 (46.9%) | 15 (30.6%) |
| Faculty (%of total) | 11 | 10 (90.9%) | – | 1 (9.1%) |
| Total number (%) | 60 | 21(35.0%) | 24(40.0%) | 15(25.0%) |
Table 1a. Response rate for Activity and Sleep Data Capture
| ESS1 | ProQoL1 | ESS2 | ProQoL2 | |
| PGY1(n=49) | 43 (87.8%) | 43(87.8%) | 28(57.1%) | 27(55.1%) |
| Faculty(n=11) | 10(90.9%) | 10(90.9%) | 10(90.9%) | 9(81.8%) |
| Total (n=60) | 53(88.3%) | 53(88.3%) | 38(63.3%) | 36(60.0%) |
|
ESS: Epworth Sleepiness Scale (ESS1 at start of study, ESS2 at end time point of study) ProQoL: Professional Quality of Life Survey (ProQoL1 at start of study, ProQoL2 at end time point of study) |
||||
Table 1b. Response rate for Survey Data Capture
| Complete Data
n=11 |
Incomplete Data
n=38 |
p values | |
| Mean age (range) | 25.2 (25-27) | 25.2 (25-28) | 0.907 |
| Mean Weight in kg (range) | 58.8 (43-77) | 57.9 (41-80) | 0.811 |
| Mean Height in cm (range) | 167.3 (153-185) | 166.3 (151-183) | 0.753 |
| Gender | |||
| Male (%) | 5 (45.5) | 16 (42.1) | 0.99 |
| Female (%) | 6 (54.5) | 22 (57.9%) | |
| Medical problems | |||
| Yes (%) | 2 (18.2) | 3 (7.9) | 0.311 |
| No (%) | 9 (81.8) | 35 (92.1) | |
| Ethnicity | |||
| Chinese | 11 (100) | 37 (97.4) | 0.99 |
| Malay | 0 | 1 (2.6) | |
| Other | 0 | 0 | |
| Medical Background | |||
| Local graduate | 11 (100) | 33 (86.8) | 0.574 |
| Overseas medical school | 0 | 5 (18.2) | |
| T-test was used for age, weight, height. Chi-square test was use for gender, presence of medical problems, ethnicity, medical background | |||
Table 2. Baseline characteristics of the residents, between the group who had complete and incomplete data
PGY1 residents have higher levels of activity compared to faculty, with a median (range) of steps of 10207.5 (280-26638) versus 8155 (481-31236) (p=0.001). They also logged significantly longer duration of both moderate and vigorous activity (26 versus 19 minutes, 95 versus 70 minutes, respectively) compared to faculty (Table 3).
In terms of the sleep comparison, PGY1 residents slept less compared to faculty, with a median (range) of 356 (114-630) minutes versus 393 (162-704) minutes (p=0.001). The time taken to fall asleep (sleep latency) was also significantly shorter (6 versus 7 minutes for the residents and faculty respectively). In addition, a higher percentage of residents (36.4% versus 18%) had fallen asleep in less than 5 minutes, correlating with severe sleepiness. Both groups showed similar sleep efficiency (Table 3).
| PGY1 (N = 49)
904 activity logs 321 sleep logs |
Faculty (N = 11)
989 activity logs 604 sleep logs |
p-value | |
| Activity levels | |||
| Median (range) steps | 10 207.5
(280-23 638) |
8 155
(481-31 236) |
0.001 |
| Median (range) duration of vigorous activity (minutes) | 26
(0-136) |
19
(0-209) |
0.001 |
| Median (range) duration of moderate activity (minutes) | 95
(0-197) |
70
(0-261) |
0.001 |
| Sleep | |||
| Median (range) amount of sleep (minutes) | 356
(114-630) |
393
(162-704) |
0.001 |
| Median (range) time taken to fall asleep (minutes) | 6
(0-54) |
7
(0-52) |
0.001
|
| (%) of participants who took <5 minutes to fall asleep | 36.4 | 18 | 0.001 |
| Sleep efficiency > 85% (% of participants) | 98.4 | 98.7 | 0.775 |
Table 3. Quantitative comparison of activity and sleep measured by wrist actigraph (FitBit)
With regard to the written survey data (Table 4), PGY1 residents had a trend to report higher fatigue scores on the ESS compared to faculty at both time points of the study, although this was not statistically significant. For the ProQoL survey, a significant higher percentage of residents reported higher burnout scores, lower compassion satisfaction scores, and higher traumatic scores. This again was consistent across both time points of the study (Table 4).
| % of PGY | % of Faculty | p value | |
| Surveys at 1st time point | |||
| ESS1 scores >10 | 61.5 | 30 | 0.09 |
| ProQoL1:Higher burnout score | 34.9 | 0 | 0.024 |
| ProQoL1:Lower compassion satisfaction | 25.6 | 0 | 0.095 |
| ProQoL1:Higher traumatic score | 20.9 | 9.1 | 0.667 |
| Surveys at 2nd time point | |||
| ESS2 scores >10 | 69.2 | 44.4 | 0.685 |
| ProQoL2:Higher burnout score | 23.1 | 0 | 0.304 |
| ProQoL2:Lower compassion satisfaction | 37 | 0 | 0.039 |
| ProQoL2:Higher traumatic score | 18.5 | 22.2 | 0.99 |
| ESS: Epworth Sleepiness Scale (ESS1 at start of study, ESS2 at end time point of study)
ProQoL: Professional Quality of Life Survey (ProQoL1 at start of study, ProQoL2 at end time point |
|||
Table 4. ESS & ProQoL scores of residents and faculty at beginning and at the end of the study
IV. DISCUSSION
Our study is not without its limitations. There was a relatively high dropout rate within residents, with only a third of the residents wearing the wrist actigraph for the entire duration of the study, and just over half of the cohort completing the end of study surveys. While the population within the resident group was almost homogenous with no difference between the group that had complete and incomplete data, we cannot be entirely certain that the residents whose data was available for analysis are entirely reflective of the whole cohort. They are likely to represent the more motivated residents who comply with the study protocol. We also recognize that use of surveys may be open to recall bias, and possibly the residents who are more fatigued are the ones completing the survey. As the drop-out rate was fairly high, repeated measures of matched data were not used to analyze the survey data at the two different time points.
Despite these limitations, our study demonstrated several interesting findings, some of which were not entirely expected. We showed that in general, faculty members sleep more and are less physically active compared to residents. However, they are also at risk of excessive daytime sleepiness with a third to half of them reporting ESS scores > 10. Although faculty members report fatigue, they appear to experience less burnout compared to residents. They also have higher compassion satisfaction scores and lower traumatic scores. These suggest that residents derive less satisfaction in their jobs compared to faculty and these findings are consistent with a local study done by Tong et al (Tong, Tin, Tan, & Lim, 2012).
Whilst lack of sleep and fatigue can contribute to burnout, faculty members are likely to have more control over their time and work schedules. In addition, with time and experience, they have also acquired the ability to cope better with the rigors of work (Girard, Choi, Dickey, Wessel, & Austin, 2006). Further studies can be done to identify what these protective factors are that faculty have acquired over the years. These can then be shared with and taught to residents.
Notes on Contributors
Marion M Aw is an Associate Professor in the Department of Paediatrics, Yong Loo Lin School of Medicine (YLL SoM), National University of Singapore. In addition to being the Program Director for Paediatric Residency Training at the National University Health System (NUHS), she also serves as the Associate Chairman, Medical Board (Education) for NUHS.
See Kay Choong is a Consultant Respiratory Physician and Intensivist, and the Program Director of the Research Residency Program, National University Hospital, Singapore. His research interests include healthcare quality improvement, epidemiology and biostatistics and the theory and practice of medical education.
Low Jia Ming and Tan Mae Yue are third year residents in the Department of Paediatrics at the National University Hospital of Singapore (NUH).
Ethical Approval
Standard institutional review board (IRB) procedures have been followed and approval obtained by the authors.
Acknowledgements
We thank Janelle Marie Liwanag and Wang Sha for assistance with data collection and Dr Dimple Rajgor for editing and submission of the manuscript.
Funding
Funding of the FitBit device was from the National University Health System Clinical Quality and Innovation Fund (NUHS CQIF).
Declaration of Interest
Authors have no conflicts of interest, including no financial, consultant, institutional and other relationships that might lead to bias.
References
Epworthsleepinessscale.com. (2016). The Epworth Sleepiness Scale. What the Epworth Sleepiness Scale is and how to use it – Dr Murray Johns. Retrieved 23 January 2016, from http://epworthsleepinessscale.com/about-epworth-sleepiness/
Fletcher, K., Reed, D., & Arora, V. (2009). Systematic review of the literature: resident duty hours and related topics: ACGME. Retrieved 25 April 2016 from https://www.google.com.sg/url?sa=t&rct=j&q=&esrc=s&source=web&cd=2&cad=rja&uact=8&ved=0ahUKEwjls-2v1KvMAhXNVI4KHUp5Cl4QFggfMAE&url=https%3A%2F%2Fwww.acgme.org%2FPortals%2F0%2FPDFs%2Fjgme-11-00-97-100%5B1%5D.pdf&usg=AFQjCNGZ9-9JKIGAeHzSHyhmjqfWfNt8uA&bvm=bv.120551593,d.c2E.
Girard, D. E., Choi, D., Dickey, J., Wessel, K., & Austin, D. (2006). A mid year comparison study of career satisfaction and emotional states between residents and faculty at one academic medical center. BMC Medical Education, 6(1), 36.
Lavidor, M., Weller, A., & Babkoff, H. (2003). How sleep is related to fatigue. British Journal of Health Psychology, 8(1), 95-105.
Lee, H., Lo, S., Chen, B., Lin, Y., Chu, D., Cheng, T., . . . Guo, Y. (2016). Increased night duty loading of physicians caused elevated blood pressure and sympathetic tones in a dose-dependent manner. International Archives of Occupational and Environmental Health, 89(3), 413.
Lourenção, L. G., Moscardini, A. C., & Soler, Z. A. S. G. (2010). Health and quality of life of medical residents. Revista da Associação Médica Brasileira, 56(1), 81-91.
Mansukhani, M. P., Kolla, B. P., & Ramar, K. (2014). International classification of sleep disorders 2 and American Academy of Sleep Medicine practice parameters for central sleep apnea. Sleep Medicine Clinics, 9(1), 1-11.
Martin, J. L., & Hakim, A. D. (2011). Wrist actigraphy. Chest Journal, 139(6), 1514-1527.
Proqol. (2016). Professional Quality of Life. Retrieved 23 January 2016, from http://www.proqol.org
Takacs, J., Pollock, C. L., Guenther, J. R., Bahar, M., Napier, C., & Hunt, M. A. (2014). Validation of the Fitbit One activity monitor device during treadmill walking. Journal of Science and Medicine in Sport, 17(5), 496-500.
Thorpy, M. J. (2012). Classification of sleep disorders. Neurotherapeutics, 9(4), 687-701.
Tong, S. C., Tin, A. S., Tan, D. M., & Lim, J. F. (2012). The health-related quality of life of junior doctors. Annals, Academy of Medicine, Singapore, 41(10), 444.
Veasey, S., Rosen, R., Barzansky, B., Rosen, I., & Owens, J. (2002). Sleep loss and fatigue in residency training: a reappraisal. JAMA, 288(9), 1116-1124.
*Marion M Aw
Department of Paediatrics, National University Health System,
1E Kent Ridge Road,
NUHS Tower Block, Level 12, Singapore 119228
Tel: 65 6772 4112
Email: marion_aw@nuhs.edu.sg
Announcements
- Best Reviewer Awards 2023
TAPS would like to express gratitude and thanks to an extraordinary group of reviewers who are awarded the Best Reviewer Awards for 2023.
Refer here for the list of recipients. - Most Accessed Article 2023
The Most Accessed Article of 2023 goes to Small, sustainable, steps to success as a scholar in Health Professions Education – Micro (macro and meta) matters.
Congratulations, A/Prof Goh Poh-Sun & Dr Elisabeth Schlegel! - Best Article Award 2023
The Best Article Award of 2023 goes to Increasing the value of Community-Based Education through Interprofessional Education.
Congratulations, Dr Tri Nur Kristina and co-authors! - Volume 9 Number 1 of TAPS is out now! Click on the Current Issue to view our digital edition.
- Best Reviewer Awards 2022
TAPS would like to express gratitude and thanks to an extraordinary group of reviewers who are awarded the Best Reviewer Awards for 2022.
Refer here for the list of recipients. - Most Accessed Article 2022
The Most Accessed Article of 2022 goes to An urgent need to teach complexity science to health science students.
Congratulations, Dr Bhuvan KC and Dr Ravi Shankar. - Best Article Award 2022
The Best Article Award of 2022 goes to From clinician to educator: A scoping review of professional identity and the influence of impostor phenomenon.
Congratulations, Ms Freeman and co-authors. - Volume 8 Number 3 of TAPS is out now! Click on the Current Issue to view our digital edition.
- Best Reviewer Awards 2021
TAPS would like to express gratitude and thanks to an extraordinary group of reviewers who are awarded the Best Reviewer Awards for 2021.
Refer here for the list of recipients. - Most Accessed Article 2021
The Most Accessed Article of 2021 goes to Professional identity formation-oriented mentoring technique as a method to improve self-regulated learning: A mixed-method study.
Congratulations, Assoc/Prof Matsuyama and co-authors. - Best Reviewer Awards 2020
TAPS would like to express gratitude and thanks to an extraordinary group of reviewers who are awarded the Best Reviewer Awards for 2020.
Refer here for the list of recipients. - Most Accessed Article 2020
The Most Accessed Article of 2020 goes to Inter-related issues that impact motivation in biomedical sciences graduate education. Congratulations, Dr Chen Zhi Xiong and co-authors. - Scopus
TAPS has been accepted for inclusion in Scopus! - Best Reviewer Awards 2019
TAPS would like to express gratitude and thanks to an extraordinary group of reviewers who are awarded the Best Reviewer Awards for 2019.
Refer here for the list of recipients. - Most Accessed Article 2019
The Most Accessed Article of 2019 goes to A two-edged sword: Narrative inquiry into Japanese doctors’ intrinsic motivation. Congratulations,
Professor Hiroshi Nishigori and co-authors!
