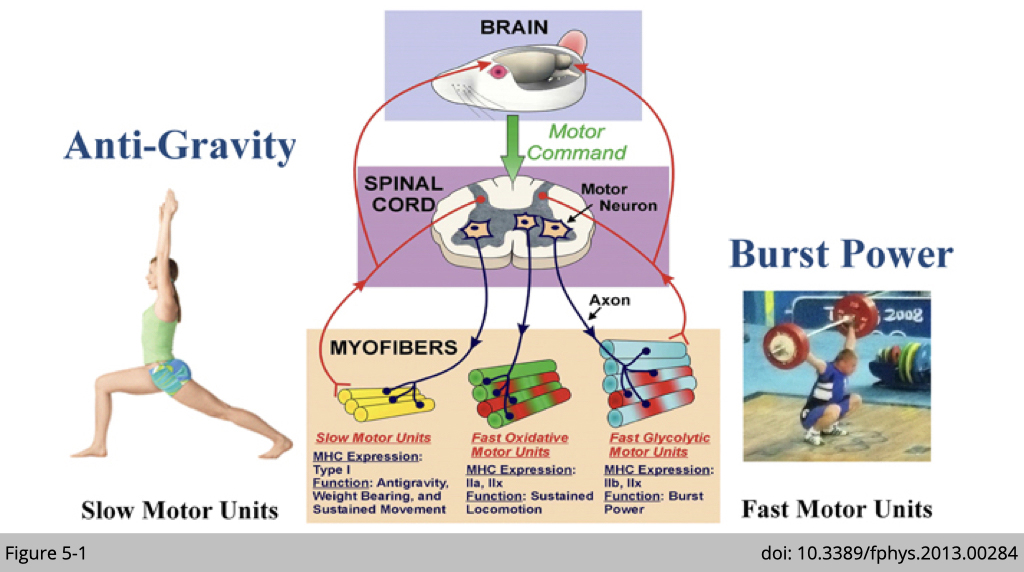
Electrophysiologic specialisation of motor unit.
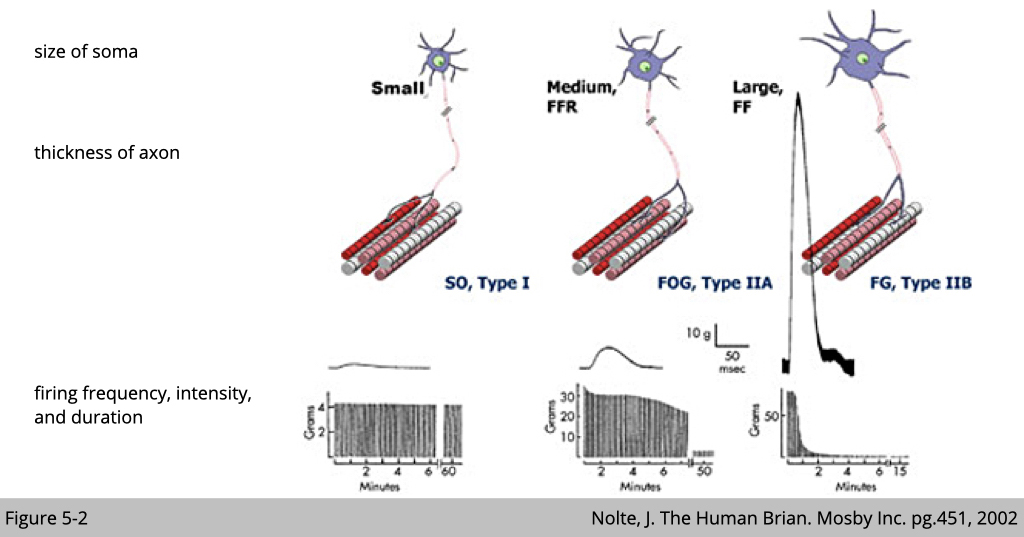
By the electrophysiologic data (Figure 5-2), we do find at least three types of alpha motor neurons whose firing frequency, intensity, and duration are distinct.
The motor neuron with a smaller cell body connect to the slow-twitch type I muscle fibers has a steady firing frequency, lower intensity, and sustained duration. On the other hand, the motor neuron with a bigger cell body connect to the fast-twitch type IIb muscle fibers in mouse and type IIx muscle in human has short and sharp firing frequency, highest intensity, and shortest duration.
Molecular identify of motor neuron subtype
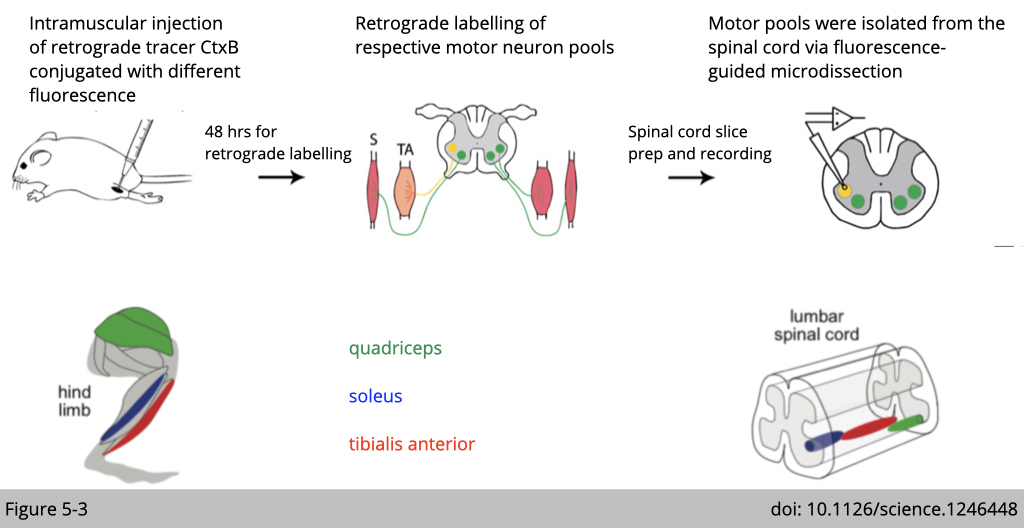
The brain is always a mystery site hidden in the skull, but skeletal muscle is much easier to approach. We know from the muscle anatomy that the soleus muscle on the back of the hind limb is enriched with type I muscle. In contrast, the quadriceps and tibialis anterior (TA) are enriched with type II muscle.
Using the retrograde tracer, cholera toxin B (CtxB) is a small molecular that the neuron can uptaken. We can then inject a retrograde tracer in the selective skeletal muscle to reversely label the motor neurons in charge.
This method helps us to map the lower motor neurons in the spinal cord (Figure 5-3). We can next dissect out those labeled motor neurons and run for RNA-seq to define their molecular identity (Figure 5-4 to 5-7).
Using transcriptome profiling to identify specific molecular markers for motor neuron subtypes.
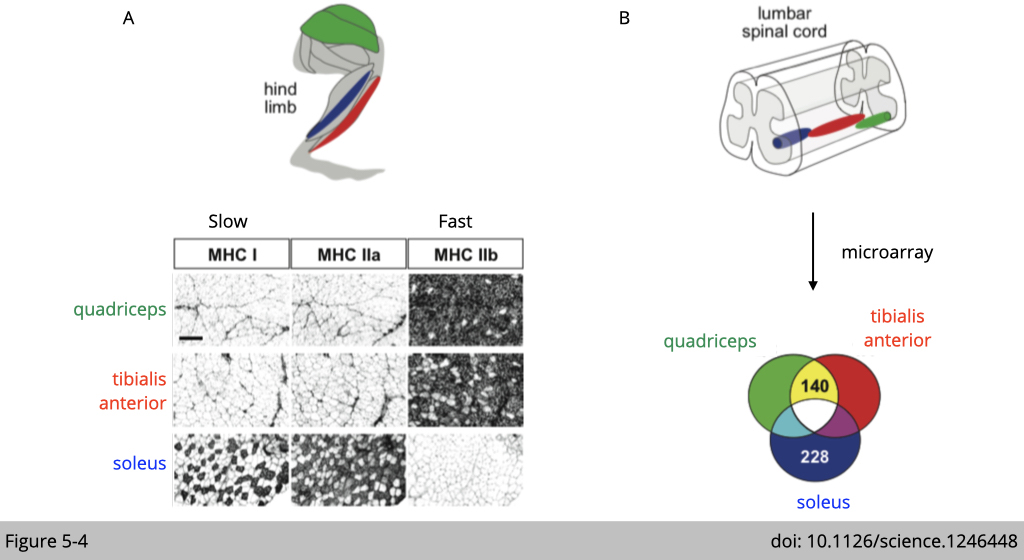
Here are the data did from Till Marquardt’s group at European Neuroscience Institute located in Germany.
Figure 5-4A is a validation of immunofluorescence (IF) staining with different myosin heavy chains to confirm that quadriceps and TAs are enriched with fast-twitch fiber and soleus are enriched with slow-twitch fiber.
Figure 5-4B is a cartoon to illustrate that the relative positions of retrogradely traced quadriceps, TA, and soleus motor pools in the lumbar spinal cord, where the cell body of a motor neuron is located. RNA was extracted from each part and performed microarray to identify the differentially expressed genes.
There are 140 genes differentially expressed in the motor neurons innervated to fast-twitch fibers, and 228 genes selectively expressed in the motor neuron innervated to slow-twitch fibers.
Expression of DLK1 is associated with a fast motor pool profile
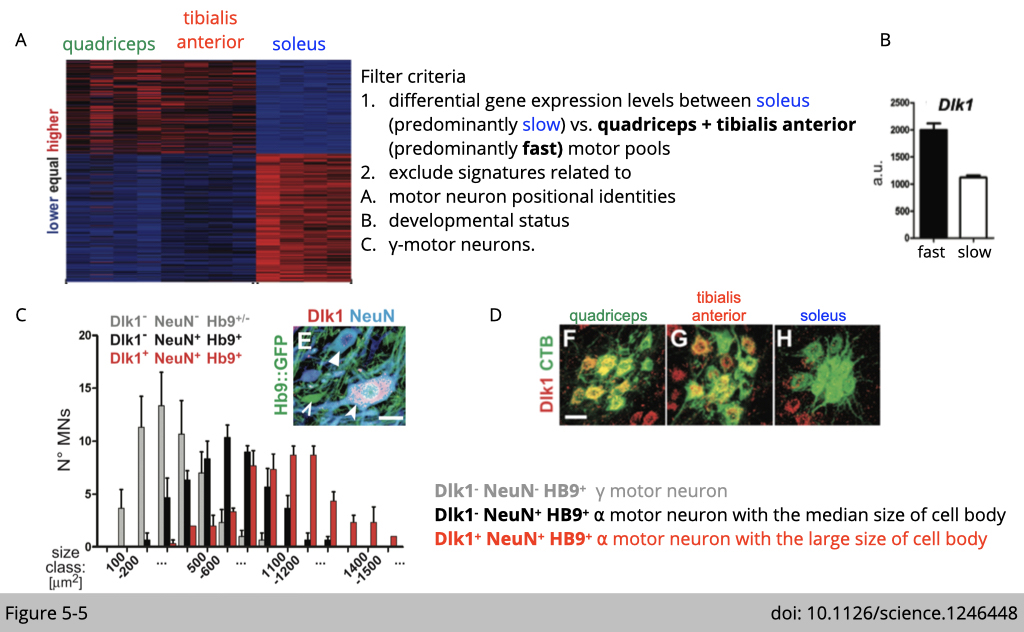
Often by this type of gene expression profile, we will have change for thousand genes. Therefore, the experimental design is crucial to screen and identify the meaningful and physiological relevant targets.
The criteria used in this study for identifying ⍺-motor neuron type markers are:
- the gene expression should be significantly differentially expressed (P<0.05 and fold change >1.5) between muscles.
- the genes involved in motor neuron positional identities, developmental status, or γ-motor neurons, which regulate muscle spindle will be excluded.
The analysis identified one of the genes associated with a fast-motor pool profile encoded Dlk1, a type I transmembrane protein related to the notch ligand 𝛅 (Figure 5-5B). DLK1 has previously been found to function in adipogenesis, postnatal myogenesis, and adult neurogenesis.
Next, the expression of DLK1 is confirmed by immunofluorescence staining that
- the expression of DLK1 is co-expressed with motor neuron markers such as neuron-specific nuclear protein (NeuN) and motor neuron transcription factors (HB9) (Figure 5-5, C and E).
- the ⍺-motor neurons expressing DLK1 are bigger than DLK1 negative ⍺-motor neurons. The size is quantified in Figure 5-5C.
- the last piece is that they confirm the selective expression of DLK1 is highly correlated with retrograde tracer CtxB injected from quadriceps and TAs. As you can see, there is an increase of yellow signal overlapping green signaling of CTxB and red signaling of DLK1 in Figure 5-5D.
Dlk1 is sufficient and necessary to promote a fast biophysical signature in motor neurons.
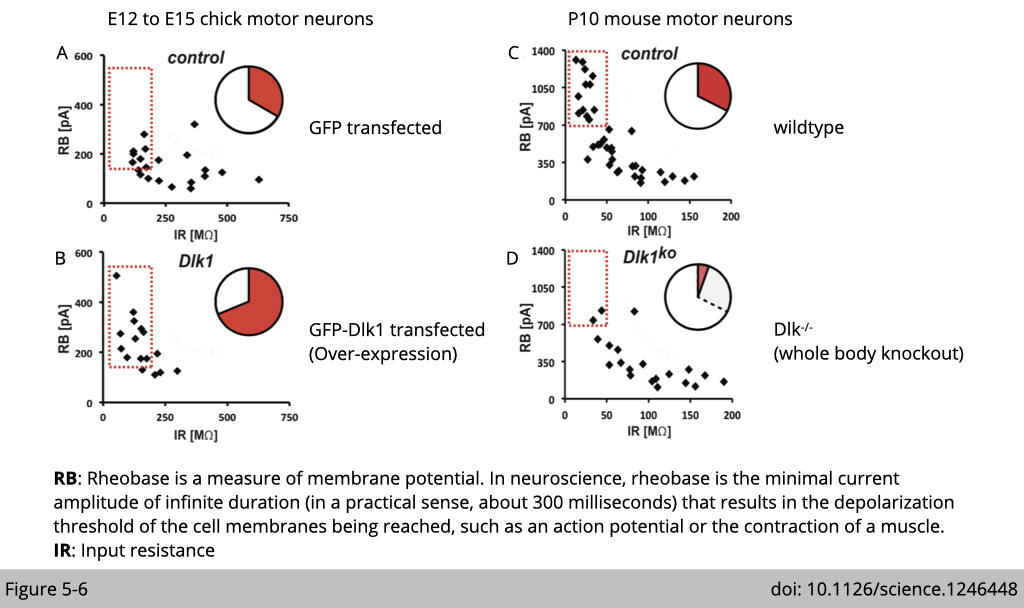
To test whether Dlk1 would be involved in motor neuron functional diversification, Marquardt’s group performed whole-cell patch-clamp recordings of motor neurons in genetically modified chicks and mice.
Over-expression of DLK1 (Figure 5-6B) in the chick spinal code shifts biophysical properties toward a profile feature of fast motor neurons, including elevated firing thresholds and frequencies compared to the control (Figure 5-6A).
Figure 5-6, C and D showed that the knockout of Dlk1 has the opposite effect. In Dlk1KO mice, a proportion of motor neurons shifted to lower firing thresholds. The experiment is performed in the spinal cord of mice with the Dlk1 gene knocked out. Motor neurons in Dlk1KO mice showed a shift in biophysical properties opposite to those driven by excess Dlk1 in the chick.
Together, these data indicated that Dlk1 is both sufficient and necessary for promoting a fast biophysical signature in motor neurons.
Reduced peak force generation upon motor neuron–specific Dlk1 elimination.
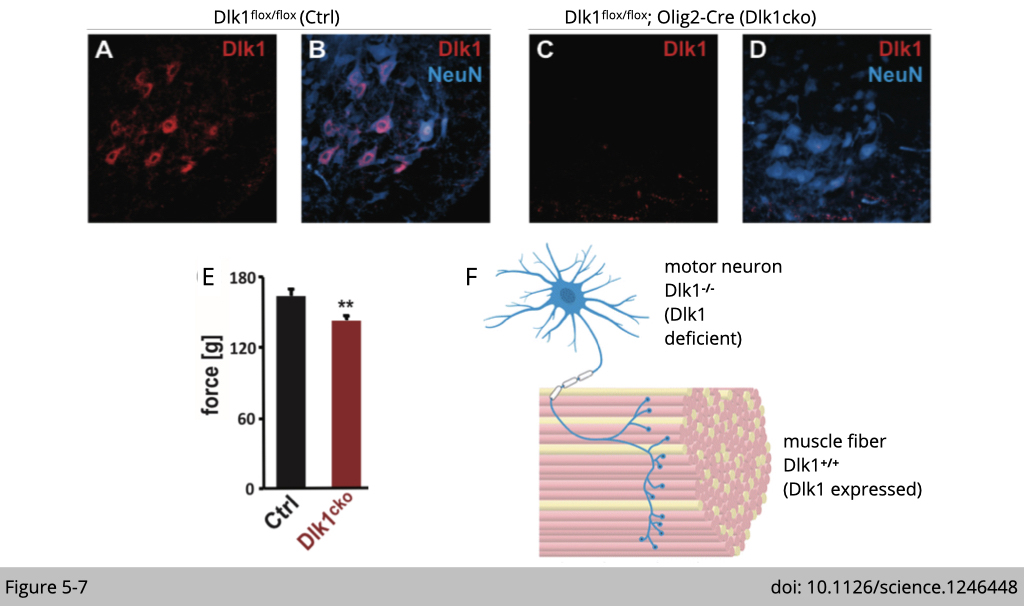
Lastly, to test how a shift away from fast toward slow/ intermediate motor neuron properties would affect muscle function, they analyzed the mice selectively lacking Dlk1 in the motor neuron lineage (Dlk1cko) using olig2-Cre, which expresses in oligodendrocyte and motor neurons (Figure 5-7F). The IF staining shows that the DLK 1 is deleted in the motor neuron, as you can see an absence of red DLK 1 signaling in the spinal code (Figure 5-7 A-D).
The only functional analysis that shows a significant difference between control and Dlk1cko mice is maximal force generation from the muscle (Figure 5-7E). Since DLK1 is highly expressed in bigger ⍺-motor neurons, which innervates fast-twitch muscle, the loss of a fast motor neuron biophysical signature in these mice thus resulted in deficient peak force outputs.
The other functional analysis they have performed are
- gait analysis- how the mouse walk (very common assay applied to human for PD diagnosis).
- rotarod test- testing the balance and some endurance capacity.
- water maze- more on navigation and some endurance capacity.
They did not find any significant difference between control and Dlk1cko mice, which is not surprising since those assays mean for testing slow-twitch (type I) muscle function. These data might suggest no compensation for the increase in slow-twitch (type I) muscle innervation.
Motor neuron drives the fate of skeletal muscle differentiation.
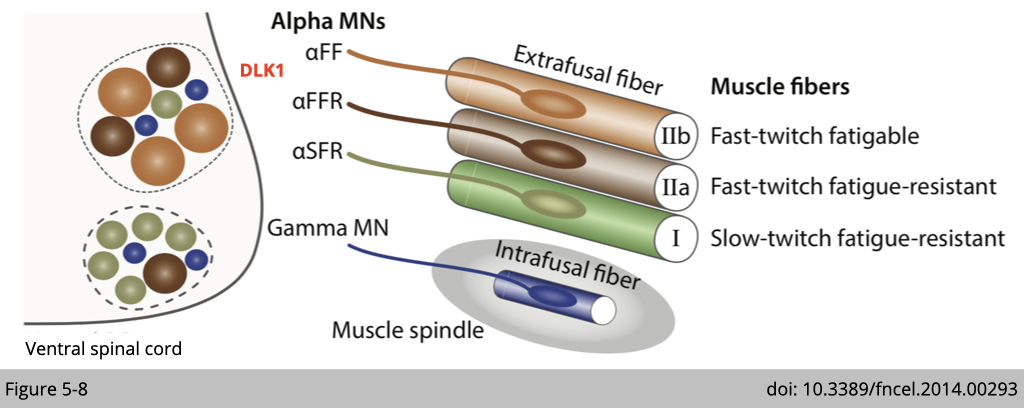
In summary, Marquardt’s group started with molecular analysis for the identification of motor neuron diversity. Next, they generated the genetically modified animals combining with physiology assays to confirm that manipulation of DLK1 expression influences biophysical properties in motor neurons and muscle.
This piece of work published in 2014 at Science has successfully identified one highly expressed marker in alpha-motor neuron innervated fast-twitch muscle fiber. These new results are the culmination of a seven-year-long research effort.
It provides insights into how the brain controls movements. This new work may pave the way for novel therapeutic strategies targeting aging and neurodegenerative diseases.
Amyotrophic lateral sclerosis (ALS) selectively affects the fast-twitch muscle activities.
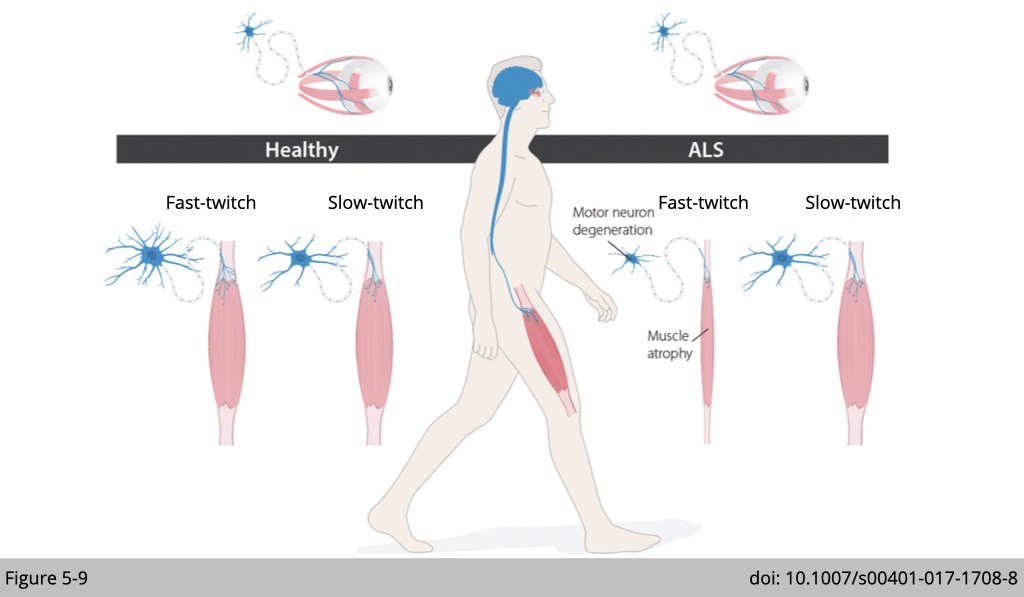
Similarly, Amyotrophic lateral sclerosis (ALS), also known as motor neuron disease, leads to paralysis and eventual death within a few years after diagnosis. ALS first affects the very same motor neurons that require Dlk1 function for their development.
Knowing the gene programs regulated by Dlk1 may eventually help resolve why some, but not all, motor neurons are sensitive to degeneration (Figure 5-9). This knowledge, in turn, has the potential to inspire therapeutic strategies for slowing or halting the decline in muscle function during aging or neurodegenerative diseases.

In principle, the dynamic interaction between actin and myosin causes muscle contraction. It generates force for power and movement.
Myosin slides along actin to contract the muscle fiber in a process that requires ATP.
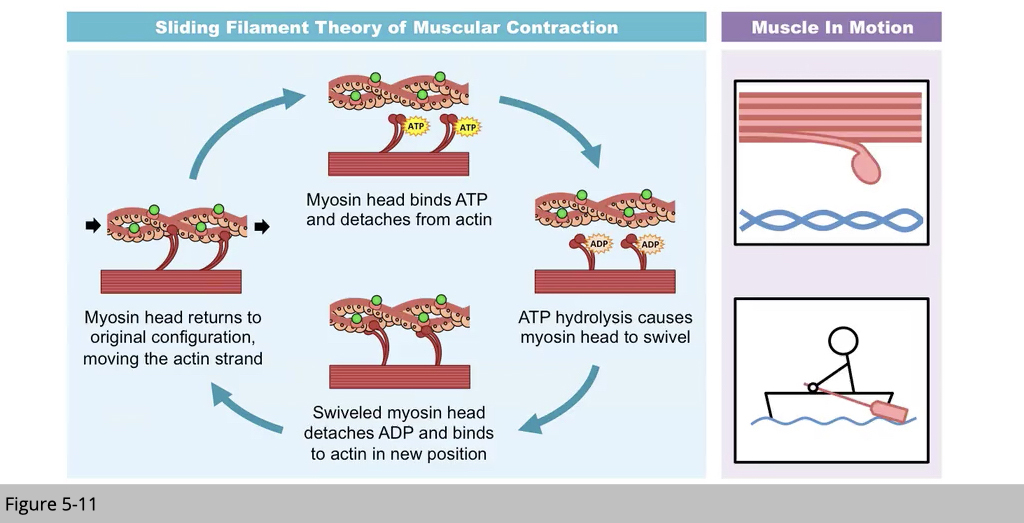
Myosin uses ATP as energy to move along the actin. The motion of muscle type of myosin is like “paddling.” These physical reactions involved ATP and calcium. The availability of ATP and calcium and the efficiency of ATP utilization influence the amplitude of power production in skeletal muscle.
Each skeletal muscle fiber type has distinct myosin composition.
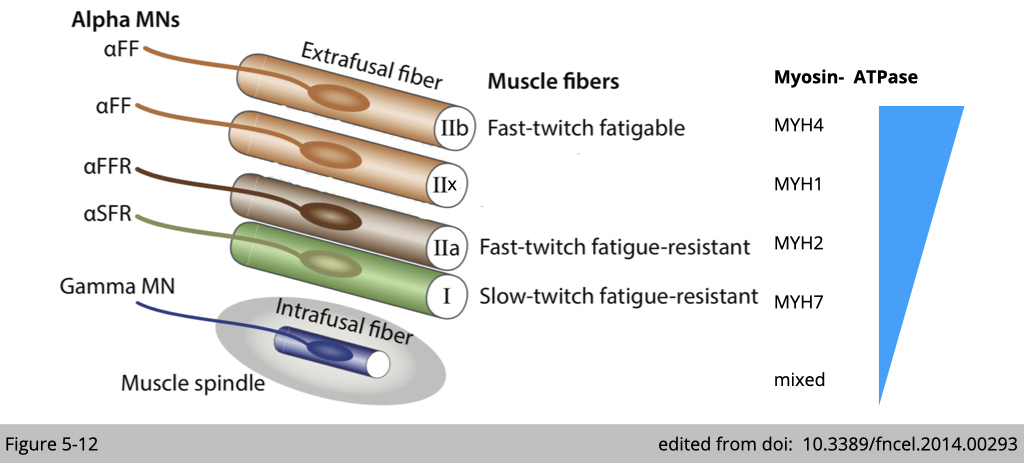
There are different types of muscle fiber used for different types of movement. Unlike motor neuron, we know quite well about each type of muscle fiber:
- the force each generates
- the metabolism they use
- the molecular signature of each fiber
Notably, four different genes encoded myosin heavy chain are identified in rodents, and three are found in humans. The molecular signature of each muscle type matches the differential power generation and energy demand. For instance, the subtype of myosin for type II fast-twitch fatigable muscle, MYH4, has the highest ATPase activity, which requires a lot of ATP supply quickly.
Different muscle fiber types adapt different metabolism to match their energy demand.
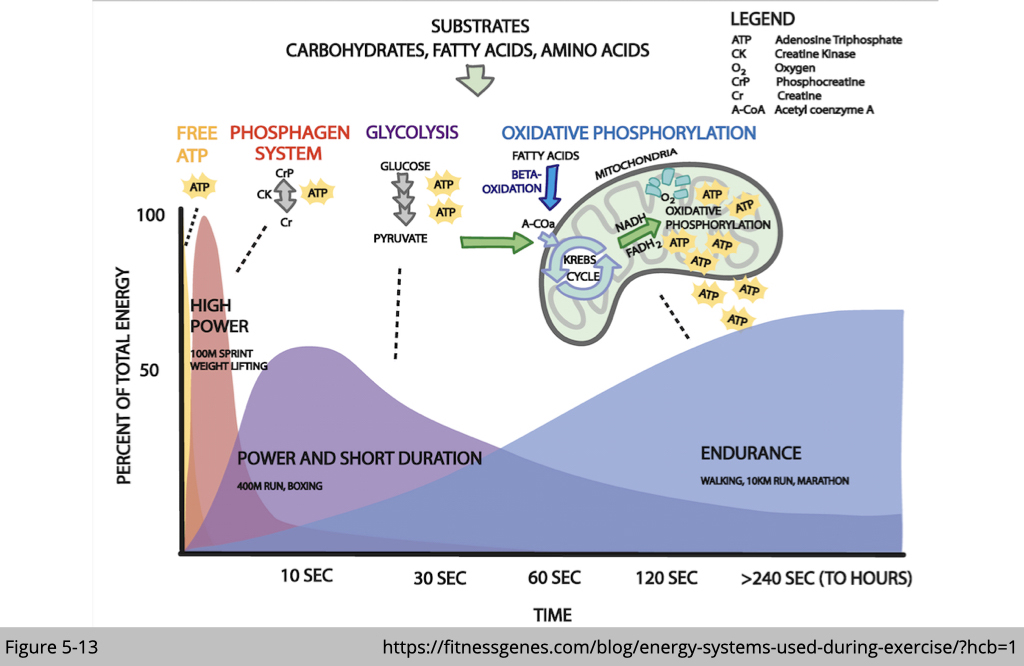
Free ATP, phosphagen system, and glycolysis are the primary ATP resources for Type IIb muscle. Because of the total amount of ATP and the metabolic by-products generated from those processes, type IIb muscle exhausts ATP and gets fatigued quickly. Even though oxidative phosphorylation generates more ATP, the rate of ATP generation is too slow to satisfy this kind of demand.
On the other hand, the ATPase activity of MYH7 in the type I muscle is the lowest. It prefers the sustained ATP supplies from mitochondria.
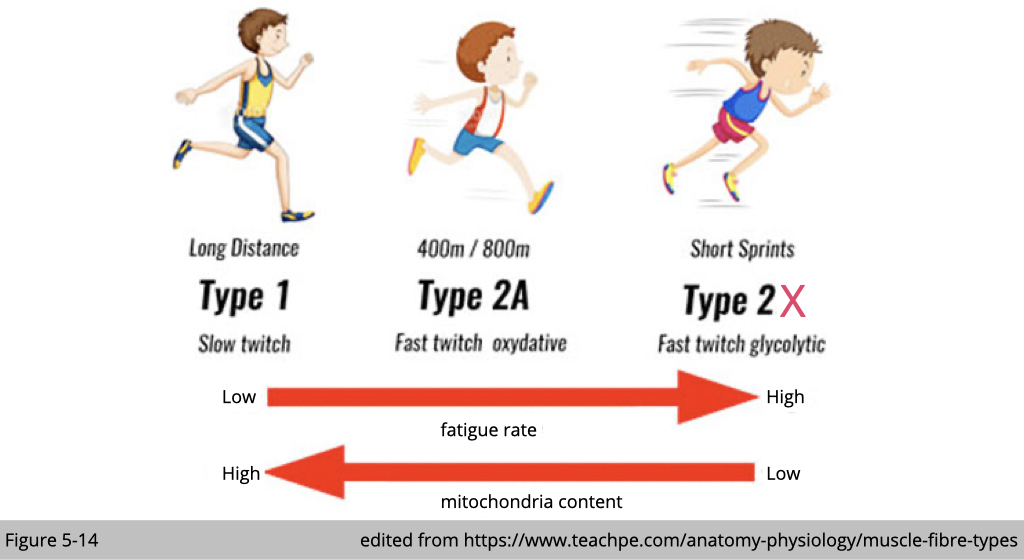
We now know that energy demands and supplies are varied in each muscle type. Using the staining to differentiate the activity of ATP hydrolysis or the number of mitochondria content, we can distinguish different muscle subtypes.
Endurance training promotes type I muscle transformation.
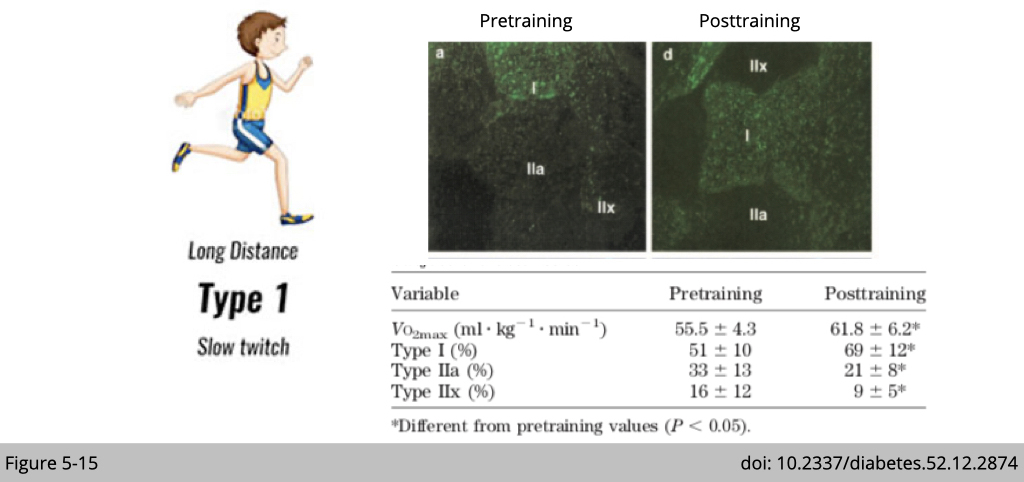
We know that the muscle is trainable. The marathon runner has a greater number of type I muscle compared to us. Type I fibers specialize in long-duration contractile activities and are resistant to fatigue.
A study recruited seven healthy men, age (mean ± SD) 34 ± 5 years, mass 78 ± 8 kg, maximal oxygen consumption (VO2max) 54 ± 4 ml · kg−1 · min−1, participated in endurance running training for 6 weeks. Figure 5-15 shows the result of the IF staining against MYH7, which targets slow fiber, and the quantification of each fiber type in the vastus lateralis muscle. The number of types I muscle is increased after 6 weeks of endurance running training associated with a greater maximal rate of oxygen consumption. The increase of type I fiber was accompanied by a decrease in both type IIa and IIx fibers.
Resistance training promotes type II muscle transformation.
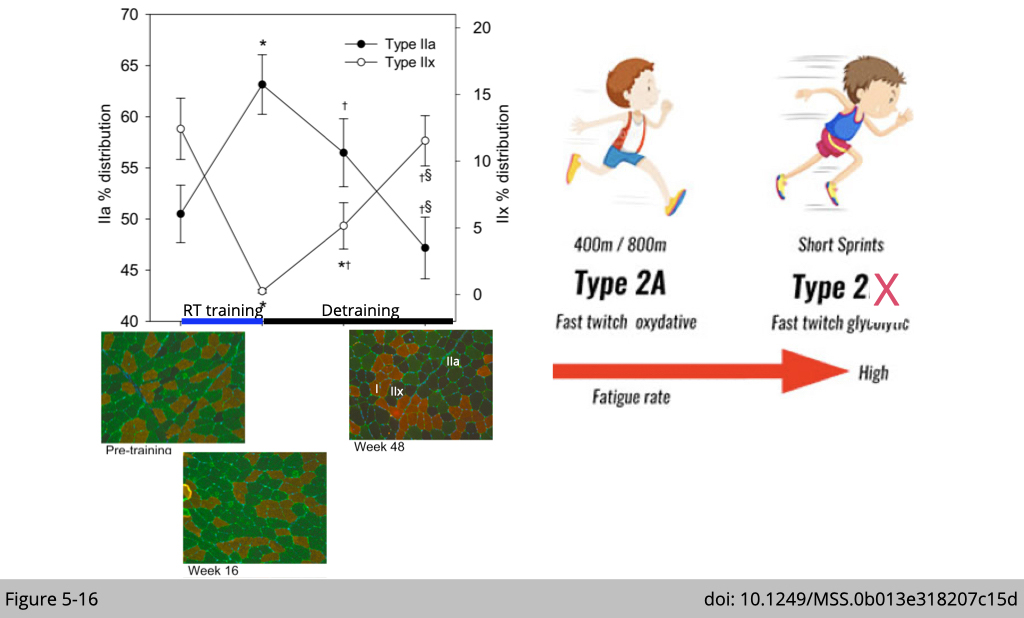
Figure 5-16 demonstrated a trial of seventy adults who participated in a two-phase exercise trial that consisted of resistant training (RT) on 3 d·wk for 16 wk (phase 1) followed by a 32-wk period (phase 2) with detraining.
Phase 1 of RT resulted in expected gains in strength, myofiber size, and muscle mass. Examination of muscle type via IF staining of different MyHC marks type IIx muscle in black, type IIa muscle in green, and type I muscle in red (Figure 5-16). Yet opposite we thought, there is an IIx-to-IIa shift in myofiber-type distribution.
The shift observed in Figure 5-16 is typically considered favorable for fatigue resistance. Both type IIa and type IIx are fast-twitch fibers. Yet, type IIa is more fatigue resistance compared to type IIx.
It is speculated that the increase in the relative amount of type IIa and a documented two-fold greater hypertrophy of the fast fibers and the training-induced increase in maximal muscle strength is highly beneficial in a wide range of sports.
Note that the muscle type transformation induced by exercise is “transient.” If the participants did not maintain the training, the RT-induced IIx-to-IIa myofiber-type shift after training was fully reversed during detraining.
Sustained resistance training maintains the IIx-to-IIa shift and continued myofiber hypertrophy and strengthen.
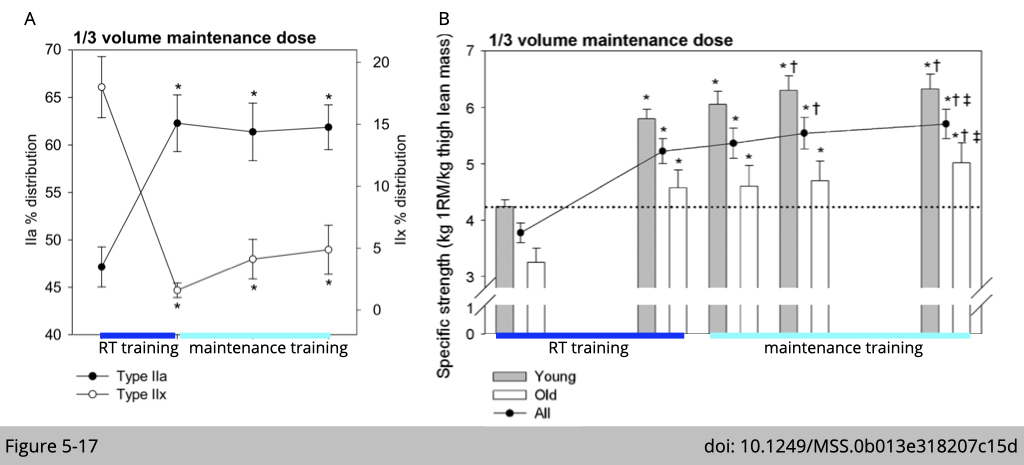
However, suppose the participants could keep one-third of the initial 16-wk RT program for another 32 weeks. In that case, they could preserve the IIx-to-IIa shift (Figure 5-17A) and resulted in additional increments in specific strength (Figure 5-17B) during the period of maintenance training.
Take home message from those exercise studies is that you need to work hard and regularly to keep up muscle healthy.
How do you study the mechanism of muscle fiber type transformation_type I muscle?
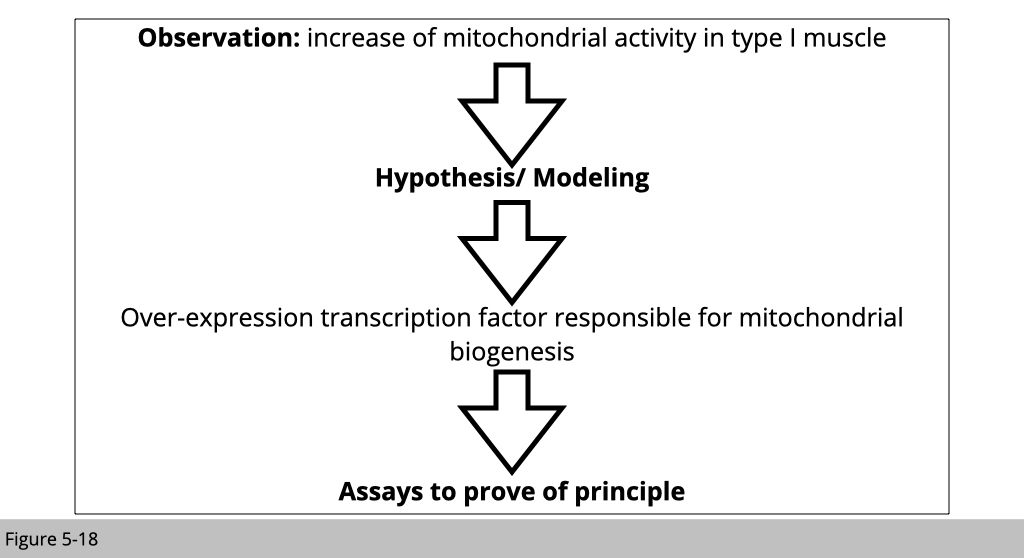
Transcriptional co-activator PGC-1⍺ drives the formation of slow-twitch muscle fibres.
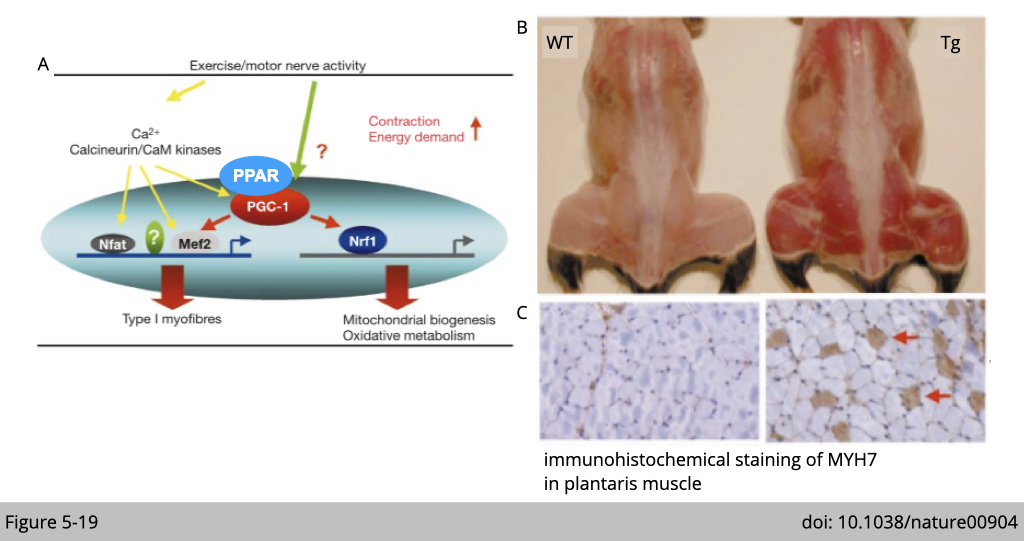
Endurance exercise stimulates PGC-1⍺ expression in skeletal muscle. PGC-1⍺ is a transcriptional co-activator interacting with the peroxisome proliferator-activated receptor (PPAR). The transcriptional targets of PPAR are broadly involved in mitochondria biogenesis and fatty acid metabolism (Figure 5-19A).
Transgenic over-expression of PGC-1⍺ in the skeletal muscle selectively induces mitochondria biogenesis. PGC1⍺ transgenic mice have an increased number of red muscles in the body (Figure 5-19B). One of the type I muscle characteristics is rich in myoglobin, which has high iron contents and can sequester oxygen for mitochondrial respiration. Therefore the muscle looks red. By the MYH7 IF staining (Figure 5-19C), which labels type I muscle, you can also observe a significant increase of type I fiber in PGC1⍺ transgenic mice.
Similar results have been observed in other transgenic mouse lines targeting factors that contributed to mitochondria biogenesis. Up-regulation of mitochondria activities increases the number of type I muscle in limb muscle.
How do you study the mechanism of muscle fiber type transformation_type II muscle?
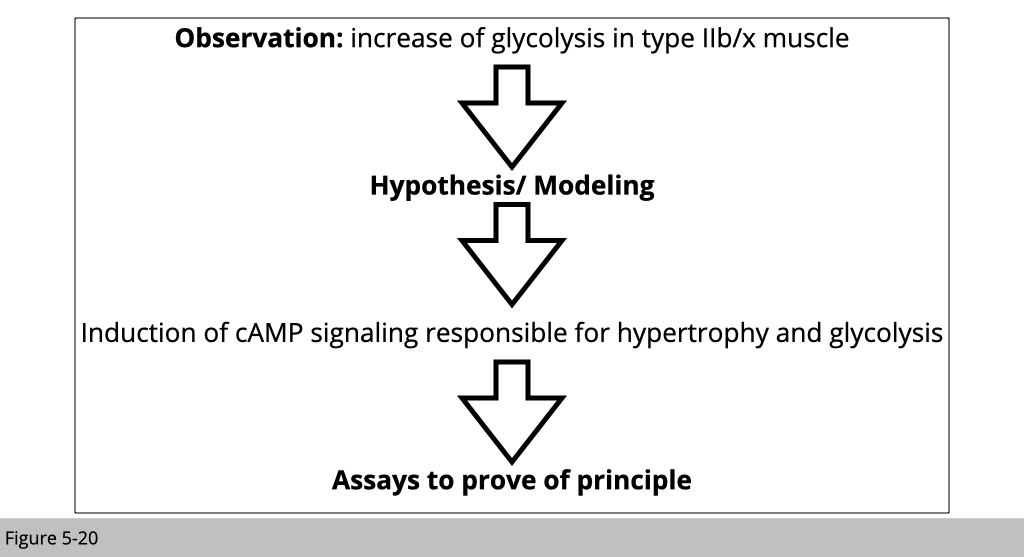
cAMP signaling triggers glycolysis.
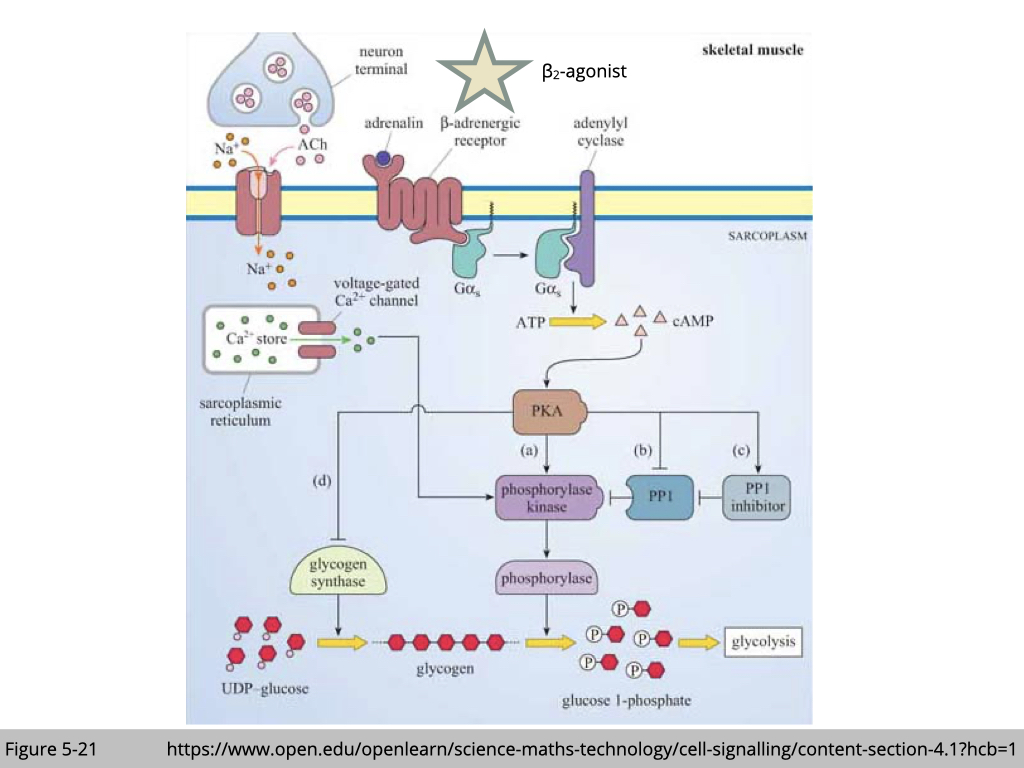
One way to activate glycolysis is through cAMP signaling (Figure 5-21). β2-agonist binds to the β2-adrenergic receptor, which in turn activates adenylyl cyclase, resulting in increased cAMP production. The downstream target of cAMP is protein kinase A (PKA). The substrates of PKA are involved in glycolysis and transcription factors promoting protein synthesis.
Clenbuterol (CLB), a β2-agonist, induces skeletal muscle hypertrophy and a shift from slow-oxidative to fast-glycolytic muscle fiber type profile.
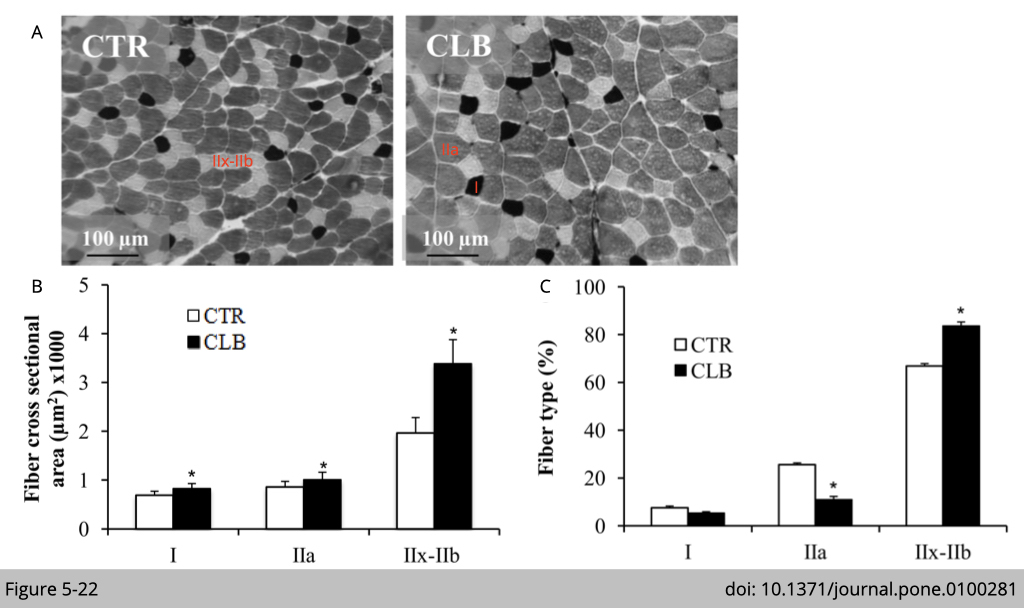
Alain Lacampagne’s group at Universite´ Montpellier in France tested whether an increased cAMP by the β-agonist treatment could induce muscle type transformation in 6 weeks old Wistar male rats. By treating rats with β-agonist for 21 days, there is an increase of IIx-IIb muscle fiber size (Figure 5-22B) and number (Figure 5-22C).
The data shown in Figure 5-22A is histochemical staining for myosin ATPase in the extensor digitorum longus (EDL) muscle. Histochemical staining for myosin ATPase is the traditional assay to map fiber type in muscle. ATP is the reaction energy source and substrate for this assay, Pi is the reaction product, and myosin-ATPase is the enzyme. The amount of Pi production can be used to quantify the activity of myosin-ATPase. Since Pi is invisible, the assay requires Pi to be chemically reacted with calcium in order to form the precipitate calcium phosphate (CaPO4). Subsequent steps convert CaPO4 into cobalt sulfide (CoS2), which is brownish-black, more easily viewable, and less soluble. The fiber, which has a higher activity of myosin-ATPase, would consume more ATP and produce more Pi deposited on the muscle tissue section.
Next, to further differentiate ATPase activities from different fiber types in muscle, it was shown previously that the pH-dependency of ATPase activity is varied between different types of muscle myosin. ATPase of type II muscle fiber is alkali-stable, while ATPase of type I muscle fiber is acid-stable. Acid preincubations were used to inhibit the myosin ATPase activity in fast (type IIa, IIx, and IIb fiber types at different degrees), but not slow (type I) in Figure 5-22A. The dark stain highlights fibers that mainly express Myosin Heavy Chain-I (MyHC-I); the light stain indicates fibers that mainly express MyHC-IIa. The intermediate color corresponds to fibers that mainly express MyHC-IIx-IIb.
Treatment of CLB increases absolute force and increases muscle fatigue.
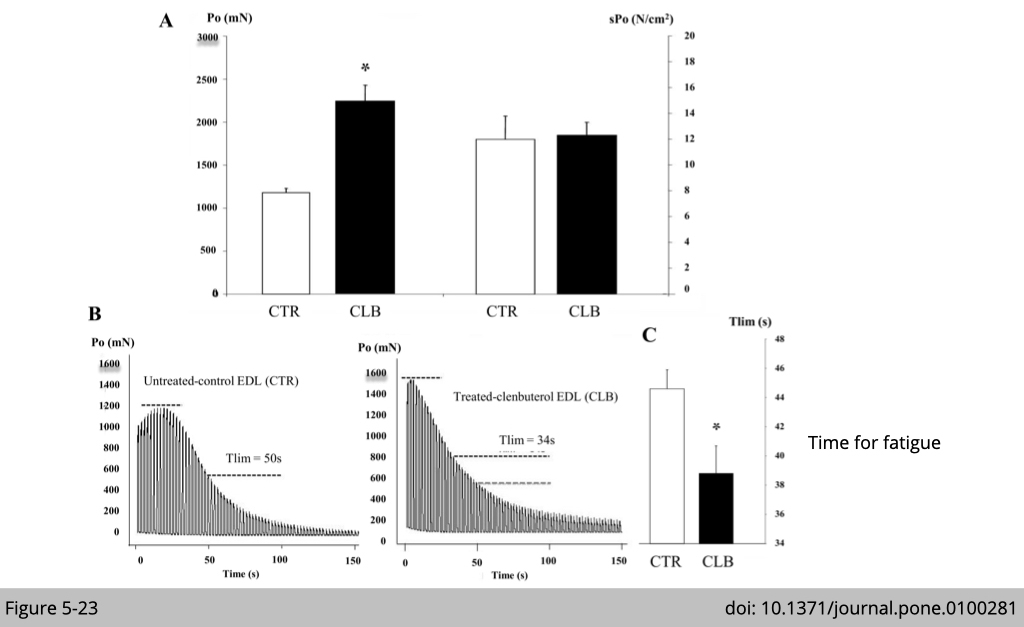
Physically, those mice treated with β-agonist increase absolute force generation per fiber (Figure 5-23A left Po). Since the type IIx/IIb muscle is hypertrophy, the relative force remains the same when normalizing the force to fiber size (Figure 5-23A right sPo). The muscle from CLB-treated rats gets fatigued much easier (Figure 5-23, B and C).
Similarly, transgenic over-expression of protein kinase B, more commonly referred to as Akt, promotes glycolysis and induces type II muscle transformation as well.
Together, those genetic and pharmaceutical studies suggest that metabolic transformation corresponds to muscle type transformation.

