By its name, skeletal muscle is attached by tendons to the bones of the skeleton. The names of skeletal muscles are often derived from which bones are severed as levers. The contraction of limb muscles moves bones across the joint, which in turn causes locomotions.
Skeletal muscle, instead of compositing numbers of cells, is made up of numbers of myofibrils. Myofibril is unique by its multinucleated compositions formed by the fusion of multiple myoblasts, mono-nucleate muscle progenitor cells. During muscle differentiation and maturation, nuclei migrate from a central position to the periphery of the myofibril. The exact process of nuclei migration has also occurred in muscle regeneration, in which satellite cells (adult muscle stem cells) differentiate and fuse to existing myofibril for repair.
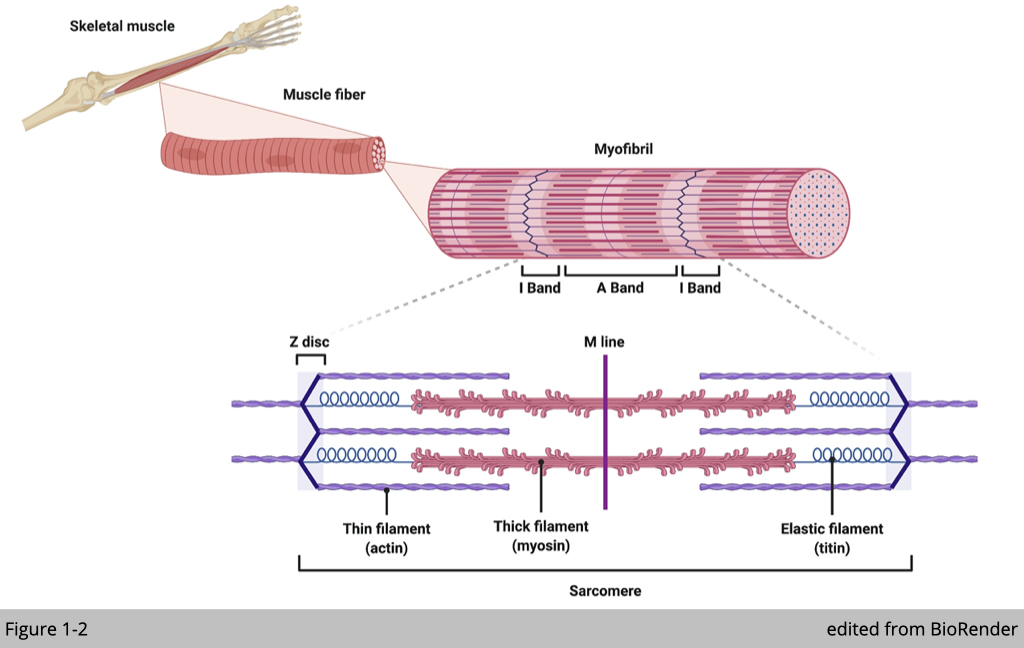
Myofibril is elongated and cylindrical in shape. Under microscopes, each myofibril has a striped or striated appearance as a result of highly organized actin and myosin that are present along the length of myofibrils (Figure 1-2). The interaction of actin and myosin can change the length of myofibril, which produces contractile force. The contractile properties such as duration, velocity, and power outputs, are dependent on the ATPase activity of myosin heavy chains (MHC). Different compositions of MHCs define the myofibril type in skeletal muscle correlates with the speed of muscle contraction.
More reading about muscle contraction: https://www.nature.com/scitable/topicpage/the-sliding-filament-theory-of-muscle-contraction-14567666/
More reading about muscle microanatomy: http://eptumed.com/skillLab3/modelShowOrgan.php?catalog=NyYxOTgmMjc=
Muscle fiber type
Skeletal muscle is a heterogeneous tissue comprised of myofibril with various contractile and metabolic properties. The heterogeneity of the skeletal muscle provides the flexibility to allow the same muscle to be used for multiple muscular activities from posture to sprint. Each muscle fiber comprises the number of myofibrils enriched with various types of myosin. We can roughly classify human limb muscles into three subtypes: slow oxidative fibers, fast oxidative fibers, and fast glycolytic fibers.
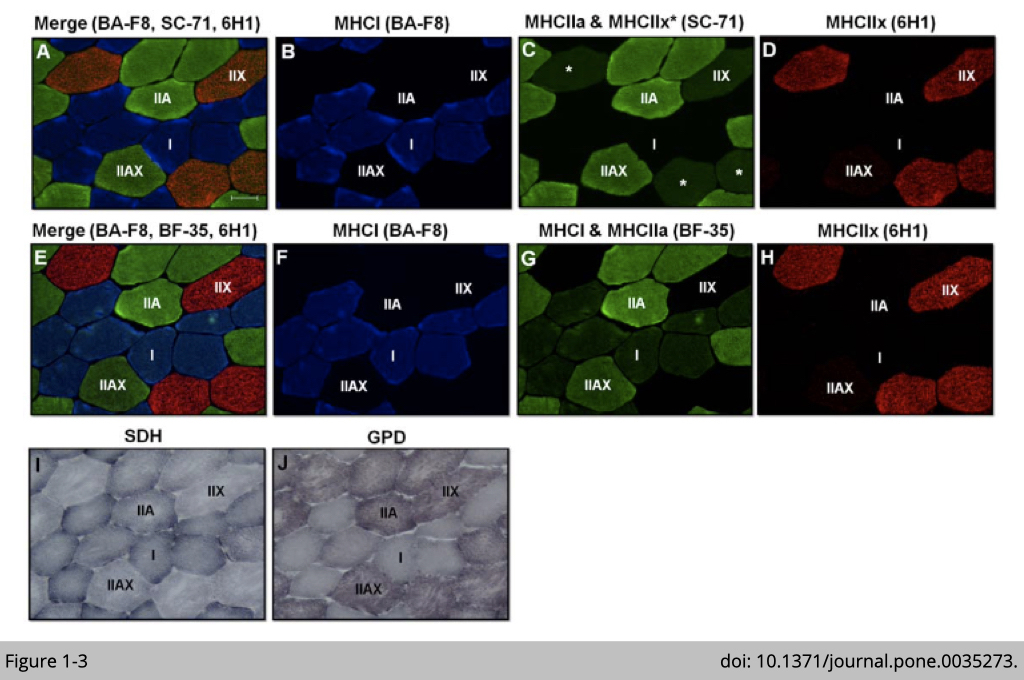
As such, slow oxidative fibers (also named as type I fibers) contain dominated expression of MYH7 and substantial activities of mitochondria reflecting oxidative metabolism. Using immunofluorescence (IF) analysis to detect the MYH7 expression (antibody: BA-F8; Blue signal in Figure 1-3, B and F) confirms the correlation of the presence of MYH7 expression and increased mitochondria number in human vastus lateralis muscle. The number of mitochondria was analyzed by histochemical analysis for SDH activity (blue staining in Figure 1-3I); succinate dehydrogenase (SDH) is a mitochondrial enzyme.
On the other hand, MYH1 is highly expressed (detected by antibody: 6H1; red signal in Figure 1-3, D and H) in fast glycolytic fibers (also named as type IIx fibers), which correlated to the high intensity for ⍺-glycerophosphate dehydrogenase (GPD) activity (purple staining in Figure 1-3J). The activity of GPD is commonly used for glycolytic potential.
Fast oxidative fibers (also named type IIa fibers) are intermediated fibers that are positive for SDH and GPD staining (Figure 1-3, I and J). MYH2 has been previously identified to be highly expressed in fast oxidative fibers. Yet, antibody: SC-71 targeting MYH2 was used to validate MYH2 expression has non-specific cross-reactivity to MYH1 in human muscle (Figure 1-3, C and D). This cross-reactivity of SC-71 was not observed in rat or mouse muscle. To further identify the type IIa fibers in humans, BF-35, an antibody noted to be specific for all MHC isoforms except MYH1, is used to differentiate type IIa and IIx fiber (Figure 1-3G).
The relative intensity of SDH activity staining is highest in slow oxidative fibers, followed by fast oxidative fibers, and is lowest in fast glycolytic fibers. Vice versa, the relative intensity of GPD activity staining is highest in fast glycolytic fibers, intermediated in fast oxidative fibers, and is lowest in slow oxidative fibers. Since the slow oxidative fibers are dense in mitochondria to allow high oxidative capacity, the slow oxidative fibers also have dense capillaries and store a large amount of myoglobin to transport and preserve oxygen respect.
For the cross-sectional area (CSA), fast oxidative fibers were the largest. Slow oxidative fibers have similar CSA as fast glycolytic fibers. Therefore, resistance training leads to muscle hypertrophy, primarily targeting fast oxidative fibers (type IIa). It has also been observed in numerous human trials that resistance training transform fast glycolytic fibers (type IIx) to fast oxidative fibers (type IIa). In contrast, the number of slow oxidative fibers (type I) is unaffected. From a functional point of view at individual fiber, a decrease of type IIx fiber with resistance training may seem counter-intuitive since type IIx fiber has the fastest contraction velocity and highest power production.
Yet, if we put the whole body into perspective, type IIx is also easy to fatigue and exhaust energy. Increased Type IIa fibers might be the much preferable outcome as a consequence of resistant training.
Satellite cell and its niche
Skeletal muscle is a post-mitotic and multinucleated tissue. The myonuclei located at the periphery of myofiber are proliferative restricted. The half-life of myonuclei was estimated to be 15 years at least in humans (doi: 10.1016/j.cell.2005.04.028), and the telomere length in myonuclei was constant from birth to 86 years (doi: 10.1089/hum.1997.8.12-1429), suggesting that skeletal muscle is highly stable tissue. Skeletal muscle has lower turnover yet has a remarkable regeneration capacity. Unlike other tissues that a damaged cell could be eliminated, skeletal muscle often takes action to fix a part of the damaged muscle fiber by removing affected myonuclei. In other words, the apoptosis of the individual myonuclei would not cause the death of the entire myofiber. The number of myonuclei is also fluctuated, corresponding to the change in muscle size. It has been shown that exercise-induced hypertrophy is accompanied by myonuclear accretion.
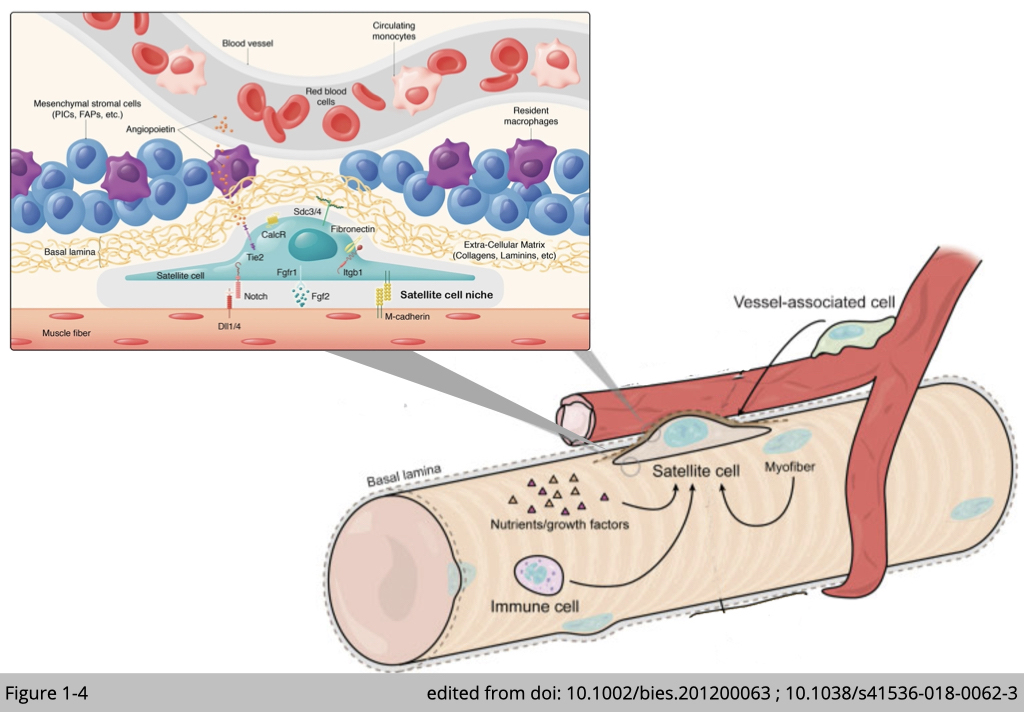
Satellite cells are skeletal muscle stem cells located outside the plasma membrane of myofiber and beneath the surrounding basal lamina. Satellite cells supply myonuclei for regeneration and remodeling to skeletal muscle. In adult skeletal muscle, satellite cells are mitotically quiescent. Upon stimulations such as exercise, they undergo asymmetric division: one daughter stem cell for self-newel to replenish the pool of satellite cells and the other daughter cell destined for differentiation to myogenic progenitor cells, myoblasts. The active myoblasts can further proliferate and differentiate and subsequently fuse with the existing fiber to add myonuclei.
It has been reported that the distribution of satellite cells is not random in myofibers. In healthy young men, most satellite cells are located close to a capillary within 15 µm in type I and 17 µm in type II muscle. The residence of satellite cells, referred to as satellite cell niche, is enriched with extra-cellular matrix, immune cells including macrophages and regulatory T-cell, and mesenchymal stromal cells including fibrocyte/adipocyte progenitors (FAPs) and interstitial cells (PIC) (Figure 1-4). The composition of those external components is remarkably dynamics. In the resting conditions, only a few cell types are found to impose the quiescence state of satellite cells. During the course of muscle regeneration, a sequence of events occurs to govern satellite cells activation. Firstly, intensive immune cells infiltrate the satellite cell niche, then FAPs and PIC over-proliferate, following with the number of capillaries increases, and satellite cells activate subsequently. At the end of muscle regeneration, those external components return to baseline levels, and satellite cells re-enter to quiescence.
In summary, those external components nourish satellite cells and respond to environmental cues contributing to muscle regeneration as well as the maintenance of the satellite cell pool.
Motor nervous system
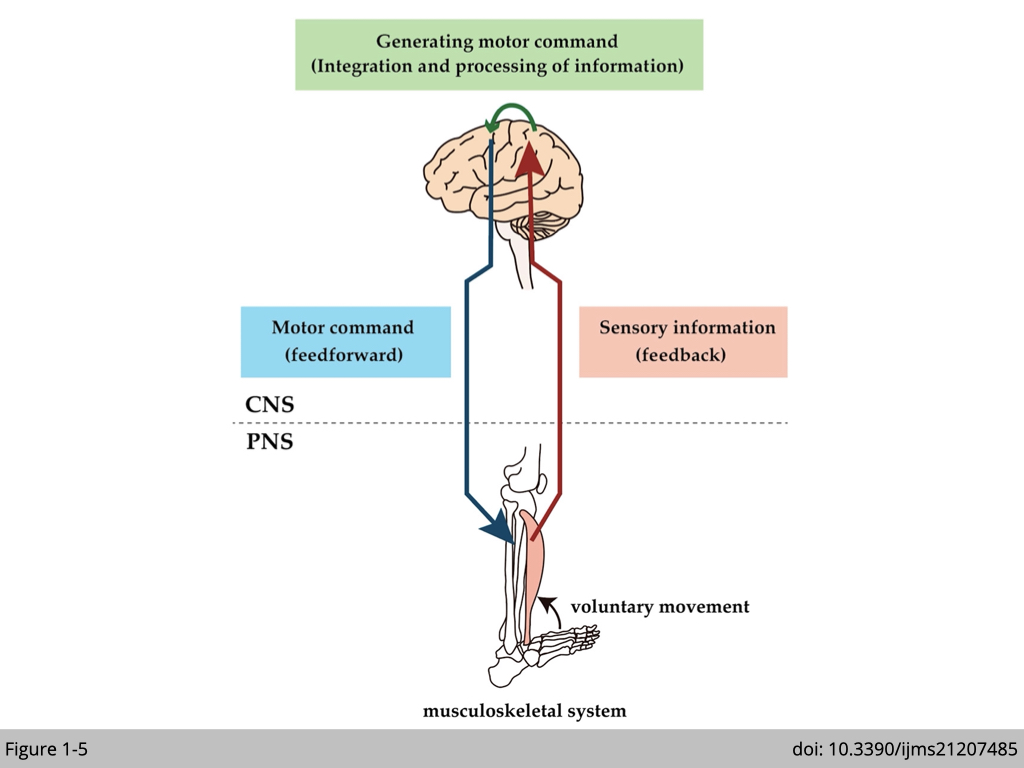
Skeletal muscle is often referred to as voluntary muscle because they are under our conscious control. Even though individual myofibril can spontaneously contract in vitro, muscle fiber contraction is tightly regulated in vivo. The brain sends electrochemical signals through the somatic nervous system to motor neurons that innervate the muscle. A single motor neuron with multiple axon terminals innervates multiple myofibrils in the same muscle fiber to synchronize their contraction (at least in the limb muscle). The result of muscle contraction then feedbacks to the brain via the peripheral sensory nerve, and the brain uses this information to adjust the movement subsequently (Figure 1-5).
The neuromuscular junction
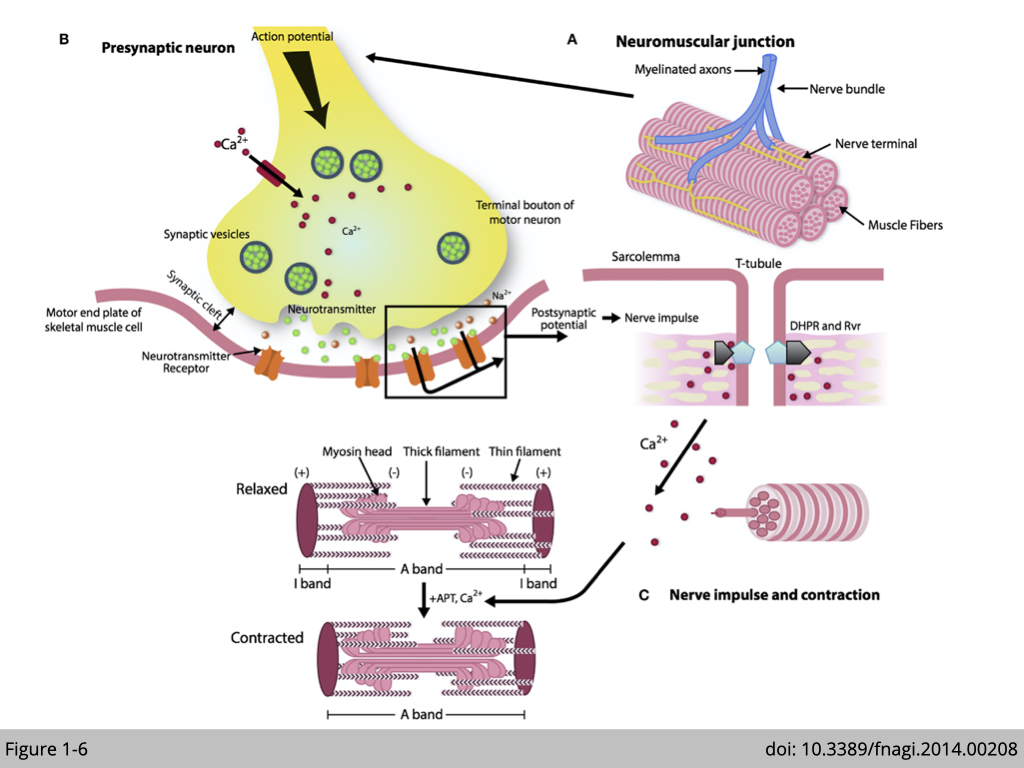
Neuromuscular junction (NMJ) is a chemical synapse transmitted signal from motor neurons to initiate contraction in myofibrils. When the motor neuron is activated, the pre-synapse (motor nerve terminal) releases acetylcholine (labeled green circles in Figure 1-6) in the synaptic cleft. The binding of acetylcholine to nicotine acetylcholine receptors in the postsynaptic membrane of muscle fiber triggers the sequential changes of action potential and signal transduction. The consequence of the cascade signaling is to release calcium (labeled as red circles in Figure 1-6) in the sarcoplasm, which induces cross-bridge cycling of myosin and actin, resulting in muscle contraction. Therefore, muscle strength depends on not only the contractile property of skeletal muscle but also the neuromuscular transmission at the NMJ.
In summary, the proper function of muscle is dependent on the quality of contractile proteins in skeletal muscle for contraction, surrounding capillary to provide sufficient oxygen, and motor neurons to coordinate muscle activities.
More reading about neuromuscular junctions and muscle contractions: https://courses.lumenlearning.com/cuny-csi-ap-1/chapter/neuromuscular-junctions-and-muscle-contractions
Diagnosis of sarcopenia
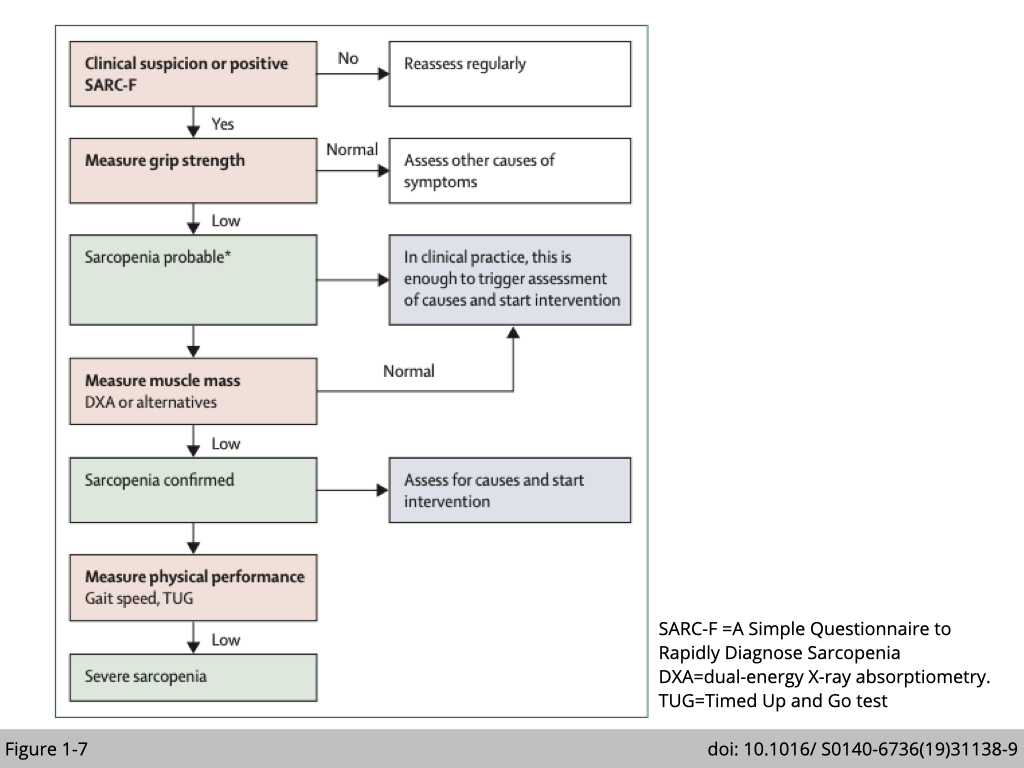
Strength, assistance with walking, rising from a chair, climbing stairs, and falls (SARC-F) questionnaire is an initial screening tool used by clinicians to identify sarcopenic patients. The SARC-F self-report questionnaire score ranges from 0 to 10: with a score ≥of 4 predicts sarcopenia. The patient will be sent for more comprehensive evaluations to confirm the diagnosis of sarcopenia (Figure 1-7).
SARC-F Screen for Sarcopenia: Component Question Scoring
Strength: How much difficulty do you have in lifting and carrying 10 pounds?
- None 0
- Some 1
- A lot or unable 2
Assistance in walking: How much difficulty do you have walking across a room?
- None 0
- Some 1
- A lot, use aids, or unable 2
Rise from a chair: How much difficulty do you have transferring from a chair or bed?
- None 0
- Some 1
- A lot or unable without help 2
Climb stairs: How much difficulty do you have climbing a flight of 10 stairs?
- None 0
- Some 1
- A lot or unable 2
Falls: How many times have you fallen in the past year?
- None 0
- 1ess than 3 falls 1
- 4 or more falls 2
SARC-F: https://www.physio-pedia.com/SARC-F:_A_Simple_Questionnaire_to_Rapidly_Diagnose_Sarcopenia
European consensus on definition and diagnosis of sarcopenia
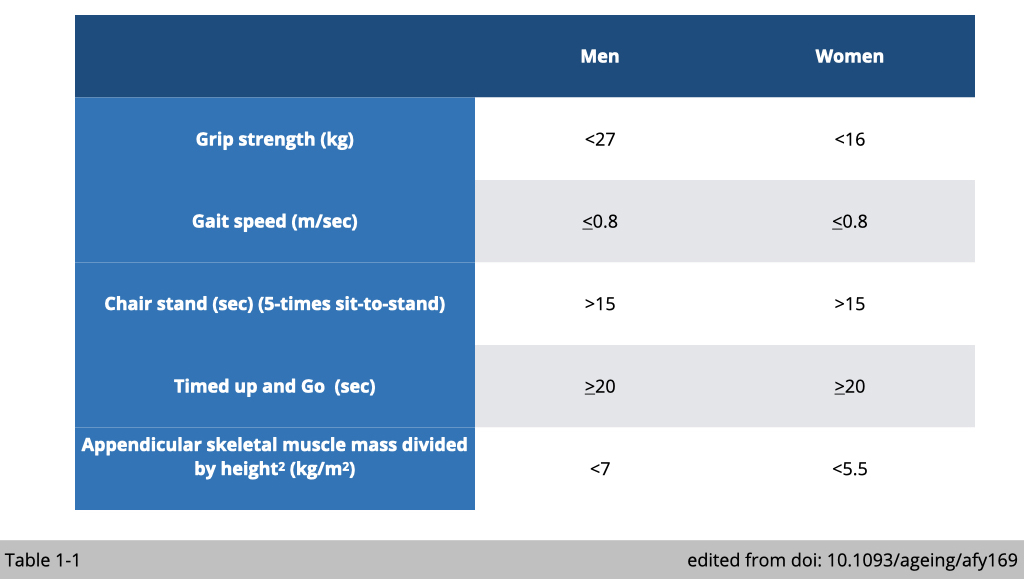
The muscular strength peaks at 20~30 years of age and slowly declines with age. Several functional assays of muscle strength and mass have been developed in clinical practice. The cut-off points for measurements of variables that identify sarcopenia have been proposed by the European Working Group on Sarcopenia in Older People (EWGSOP) (Table 1-1).
Measurement of handgrip strength by using a dynamometer is easy and inexpensive. Low grip strength has been validated as an indispensable predictor for mortality among the elderly. The low handgrip strength was defined according to EWGSOP as <27 kg for men and <16 kg for women.
Usual gait speed is calculated from the time taken to walk 4 meters. Low gait speed was defined as ≤ 0.8 m/sec.
A chair stand is used to evaluate lower body strength. The participants were instructed to perform five chair rises with arms crossed over the chest. The time was taken from the first rise from a seated position until seated again after the five rises. If the participants take more than 15s for five rises, they would be considered weak.
The timed up and go test (TUG-test) assesses functional mobility, including balance, walking ability, and fall risk in the elderly. It times how long a person takes to rise from a chair, walk 3 meters ahead, turn 180o, walk 3 meters back, turn 180o, and sit back to the chair. The cut-off point is 20 sec or more to classify subjects as frailty.
There are a couple of non-invasive methods to measure whole-body muscle mass, including a Dual-energy X-ray absorptiometry (DEXA), Magnetic Resonance Imaging (MRI), and Computed Tomography (CT). The most common practice in primary care is to measure Appendicular skeletal muscle mass by DEXA. Appendicular skeletal muscle mass was defined as the sum of the lean tissues from the four limbs. The appendicular skeletal mass (ASM) index was calculated as ASM/height2 (ASM/m2). The cut-off values for sarcopenia diagnosis is <7 kg/m2 for men and <5.5 kg/m2 for women.
Muscle quantity v.s. quality
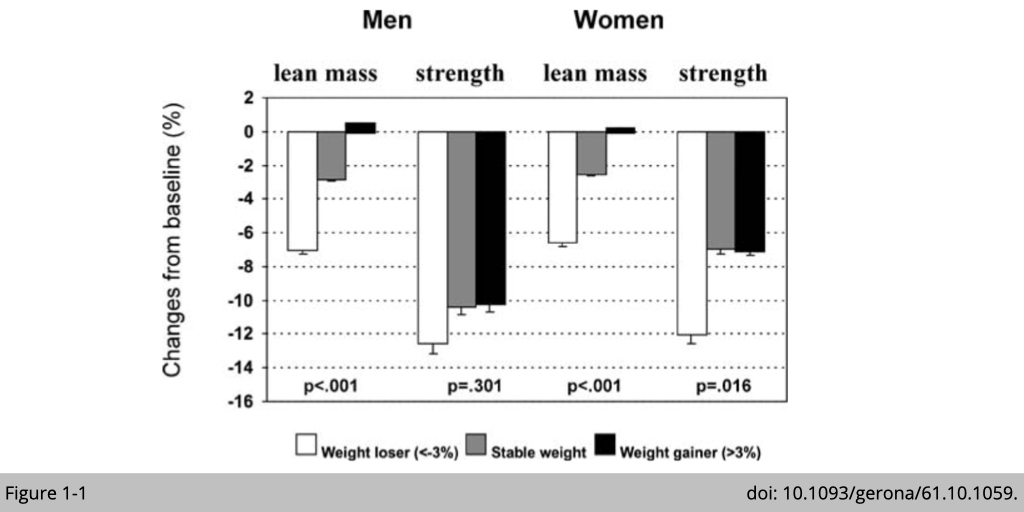
The general assumption is that larger muscles shall produce greater force. In other words, the changes in muscle strength shall be correlated with the loss of muscle mass. It seems to be the case in cross-sectional studies that lower muscle strength does correlated with less muscle mass. Yet, a couple of longitudinal studies have shown the dissociation of muscle mass and strength with age (Figure 1-1). The decline in strength was much earlier and greater than the decline in mass.
If the quantity of muscle can not predict the muscle strength in the elderly, what could predict the risk of sarcopenia development?
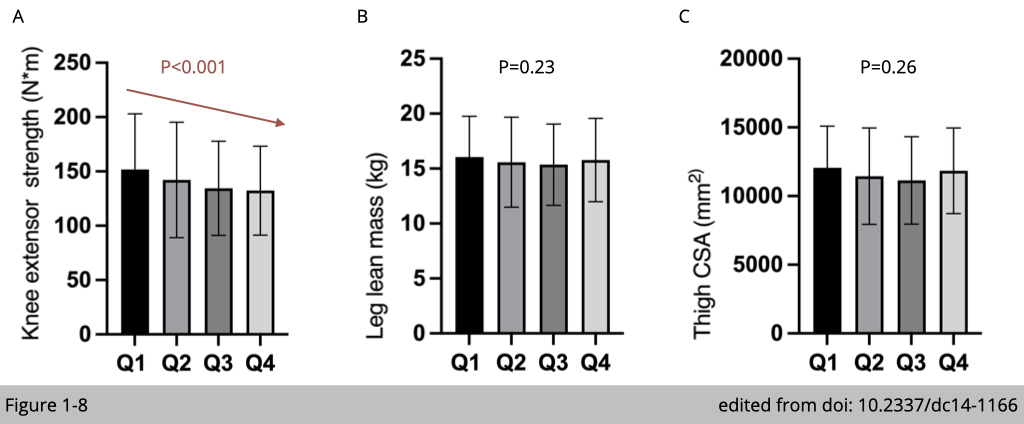
The substudy from Baltimore Longitudinal Study on Aging examined the relationship between blood glucose level and muscle strength. A total of 984 participants aged 26-96 years had measurement of HbA1c (the biomarker for hyperglycemia), lean mass by DEXA, and isokinetic knee extensor strength by Kin- Com dynamometer for average 7.5 years follow up. Within 984 participants, 726 of them had CT scans to assess the thigh cross-sectional area (CSA). The participants' HbA1c were divided into four quartiles according to their HbA1c levels (Q1: less than 37 mmol/mol, Q2: 37-40 mmol/mol, Q3: 40-43 mmol/mol, Q4: ≥43 mmol/mol). Knee extensor strength was significantly lower in the quartile 4 participants, who have the higher HbA1c levels suggesting hyperglycemia is associated with the lower muscle strength (Figure 1-8A). In comparison, there is no correlation of lean leg mass (Figure 1-8B) or thigh CSA (Figure 1-8C) with the level of HbA1c. Moreover, using the mixed-effects regression models adjusting for weight and height according to HbA1c quartile at time of visit further confirmed the decline of strength with the association of higher HbA1c quartiles (P = 0.02).
Taken together, longitudinal studies of aging suggest that muscle strength is associated with muscle quality and that the relationship is independent of muscle size. What factors may contribute to quality control in aging muscle?
Muscle changes in aging
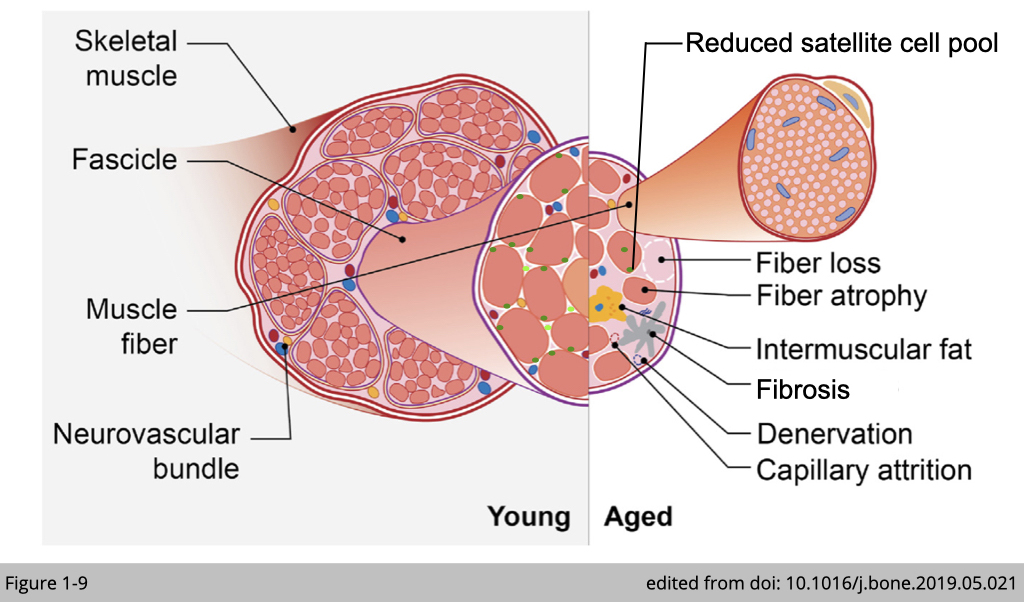
Several ultrastructural changes have been reported in aged muscle, including
- decrease in the number of fiber
- decrease in size of the fiber, particularly type 2 fibers
- decrease in the number of muscle stem cells (satellite cells)
- decrease in capillary density
- increase in denervation
- increase in infiltration of adipose tissues and Fibrosis
…etc.
These structural changes alone with a reduction of muscle mass contribute to muscle weakness. We will discuss risk factors in detail below and will emphasize those that are confirmed in humans.
Decreased number of myofiber
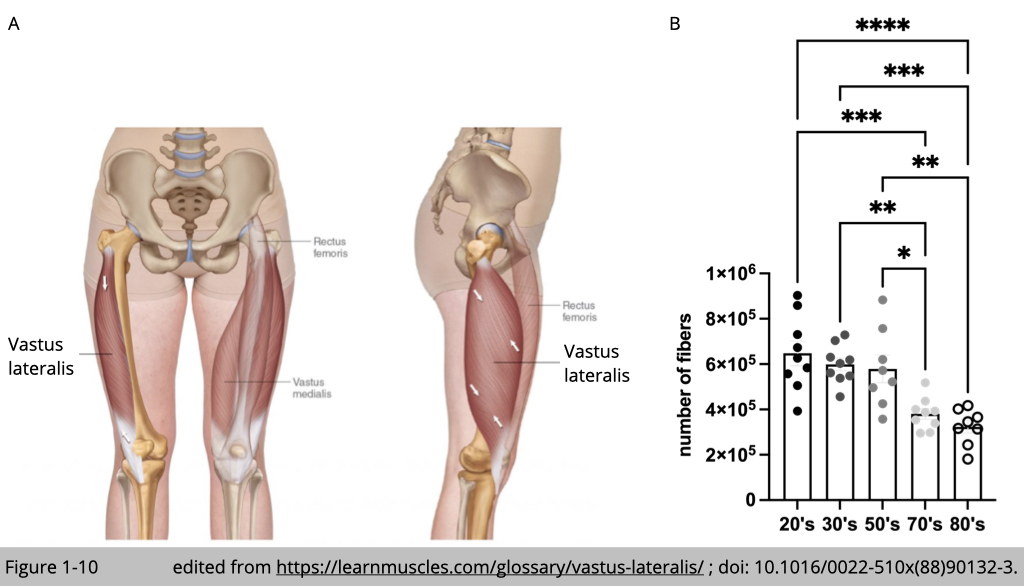
Loss of myofiber number is the principal cause of muscle atrophy with advanced age. Yet, the thoughtful quantification of total myofiber number is challenging in human subjects. A small biopsy is not sufficient for the precise quantification of the total fiber number. The measurement needed to be performed in the whole muscle, which only could be obtained from the postmortem human subject. The legendary studies from Jan Lexell and Michale Sjostrom at the University of Umea in Sweden examined the whole vastus lateralis muscle (Figure 1-10A) from 43 physically healthy men. The average reduction in the total number of myofiber from 20 to 80 years is 39% (Figure 1-10B).
Decrease in size of fiber
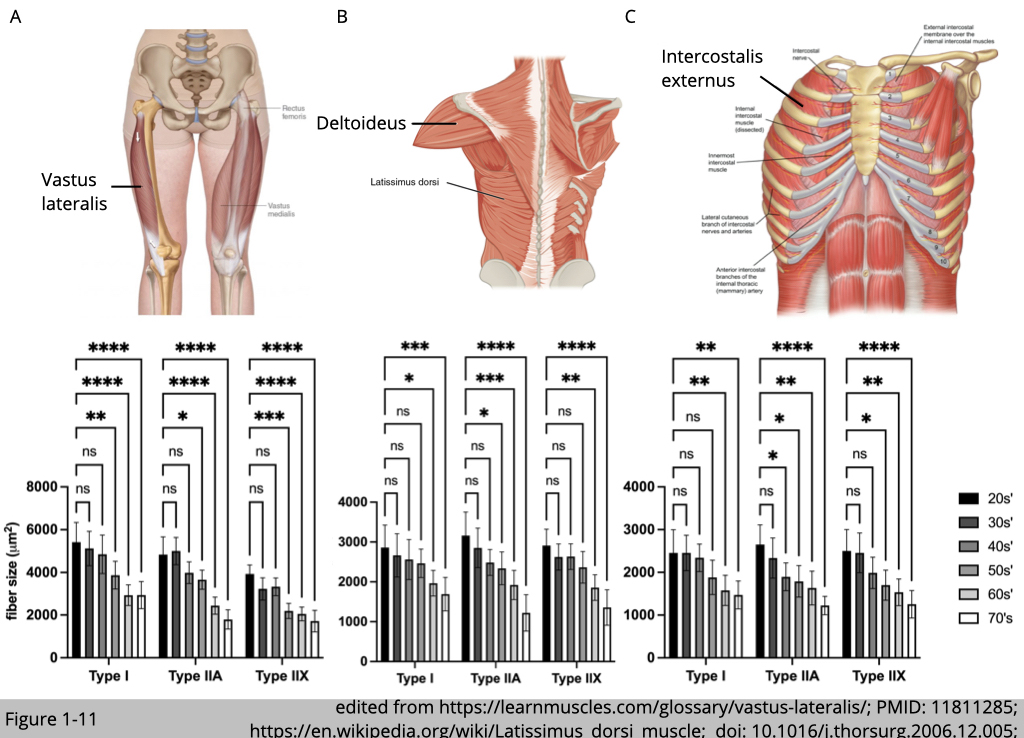
MRI, CT, and ultrasonic scanning have identified decrements in whole muscle size at an annual rate of 0.5~0.8% with advanced age. The selective atrophy among myofiber types had also been reported. T. Soic-Vranic’s group at the University of Rijeka in Croatia used immunohistochemistry staining of myosin heavy chain to label and quantify the size of type I, type IIa, and type IIx in the arm, leg, and respiratory muscles from 30 male subjects aged 20-80 years (Figure 1-11). The cross-sectional area (CSA) of all muscle fiber types decreases with age compared to the youngest group (the 20s’). Yet, the size of type IIa and IIx fibers is reduced ~60% compared to ~40% reduction in type I fibers at the age of 71-80. Other studies using the traditional histochemical ATPase method to determine muscle type have also found a similar trend that age-related atrophy affects type II muscle more than type I muscle, particularly in vastus lateralis muscle.
Changes in the morphology of muscle
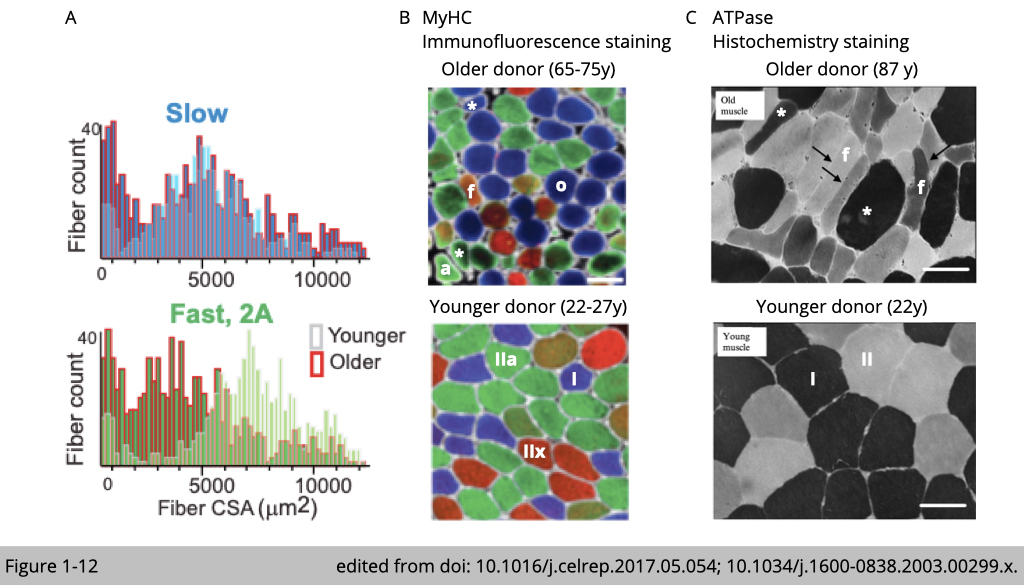
The detail morphology analysis has also found a heterogeneous distribution of fiber size in aged muscle (Figure 1-12A). The quantification of fiber size often displays a skewed distribution in young skeletal muscle in which there is a peak of fiber size present in both slow and fast type muscle. The distribution of fiber size tends to have longer tails on both sides in old skeletal muscle. The aged-related atrophic fiber atrophy is often accompanied by a compensatory hypertrophic fiber (both labeled with *), which results in the heterogeneous distribution of fiber size (Figure 1-12, B and C).
Besides the number and size of fibers, the shape of fibers has also changed with age. The aged fiber displayed angulated (labeled with a in Figure 1-12B), flat (labeled with f in Figure 1-12, B and C), or round (labeled with o in Figure 1-12B) shape features.
Decrease in number of satellite cells and capillary density
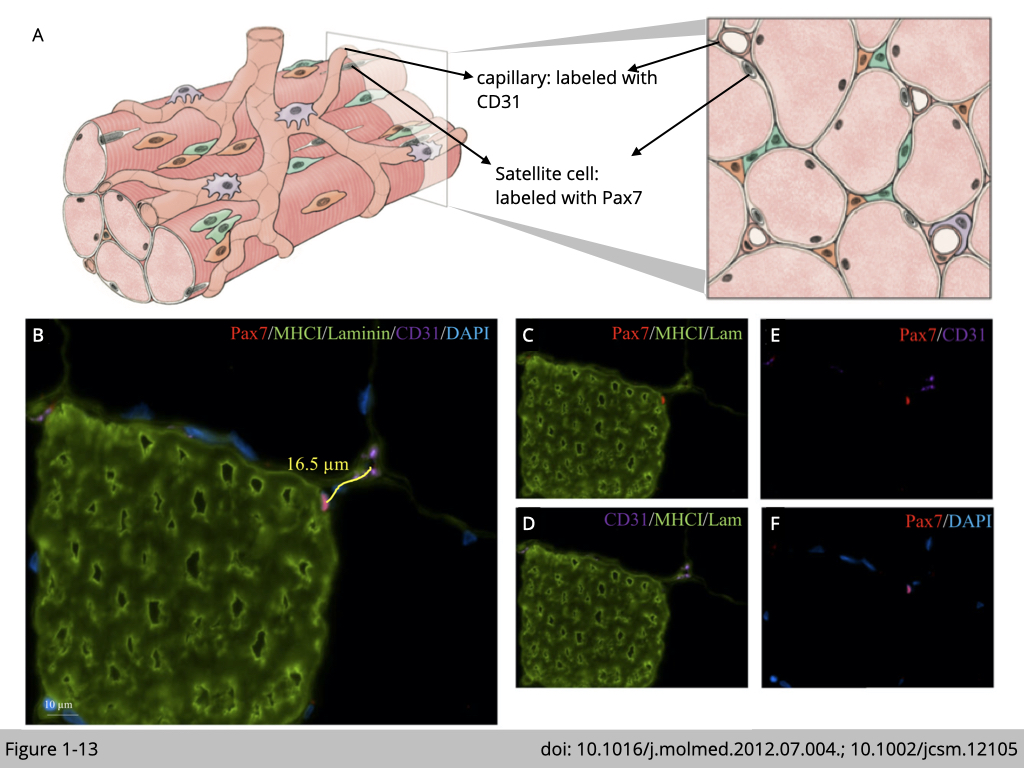
The mechanism responsible for fiber type-specific atrophy during aging remains unknown. Yet, age-associated satellite cell and capillary deformations were also reported in the elderly in a fiber-type-specific manner. Immunofluorescence staining was commonly used to study age-related ultrastructural changes in skeletal muscle (Figure 1-13).
The boundary of myofiber, basal lamina, was labeled with an antibody targeting laminin, and type-I myofiber was marked with an antibody targeting myosin heavy chain I (MHCI). The muscle fiber size is assessed by quantifying the fiber cross-sectional area (CSA) of laminin-stained cryosection. Capillary was labeled with an antibody targeting CD31, endothelial cell marker. The capillary-to-fiber ratio was calculated as the number of capillaries in an area divided by the number of fibers in the same area.
Satellite cells were labeled with an antibody targeting both Pax7, a transcription factor selectively expressed in satellite cells, and 4’,6-diamidino-2-phenylindole (dapi) targeting nuclei. In principle, satellite cells are the sole source of myonuclei supply in muscle regeneration. Activation of satellite cells contributes to myonuclei accretion. The newly added myonuclei were centra-localized (dapi positive myonuclei) in the fiber and then migrated to the periphery of fiber for maturation. Therefore, the number of central nuclei was used to indicate muscle regeneration and satellite cells activation.
Decrease in number of satellite cells and capillary density
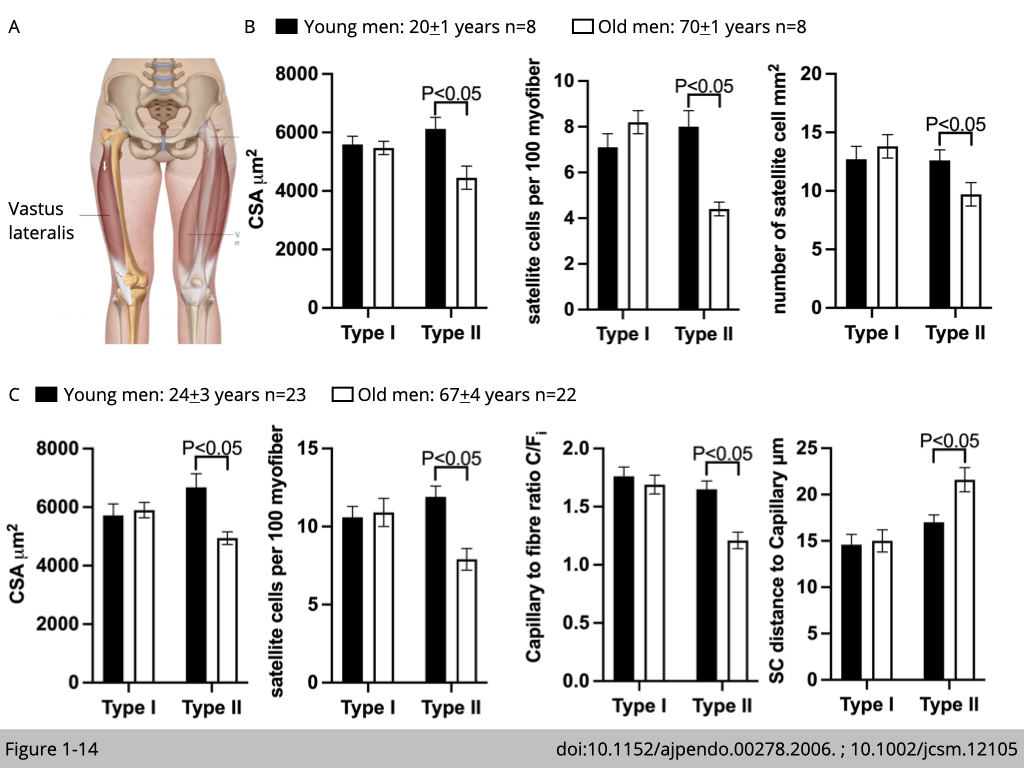
Luc J. C. van Loon’s group in The Netherlands recruited eight healthy young males and eight healthy older males to study whether the age-related atrophy in type II fiber is associated with the decline of satellite cells. Muscle biopsies were collected from the vastus lateralis in both legs. They found that the type II muscle fiber atrophy with aging was in accordance with the reduced number of satellite cells that were resided in the type II fiber (Figure 1-14B). The quantification of satellite cells was presented in two ways. First, the number of satellite cells is quantified per myofiber: number of Pax7 positive nuclei/ number of dapi positive nuclei (total nuclei). Second, the number of satellite cells is quantified per myofiber area (in mm2). Both quantifications show consistent results.
Another study led by Gianni Parise in Canada with an independent cohort further demonstrated that the decline in type II fiber satellite cells is accompanied by lower capillary content (Figure 1-14C). Capillary content was quantified by the individual capillary-to-fiber ratio (C/Fi), which was calculated as the sum of the fractional contributions of all capillary contacts around individual myofiber. Moreover, the distance between satellite cell and nearest capillary in type II fiber is increased in old men group compared with young men group.
Taken together, these cohort studies propose a model of nutrient supplement defect as an underlying mechanism for type II fiber-specific atrophy. A lower capillary content and a greater distance between capillary and satellite cells in type II myofiber might limit the circulation of nutrients and growth factors, which, in turn, restrict satellite cell growth and cause myofiber atrophy in type II fiber.
Increase in the infiltration of adipose tissues
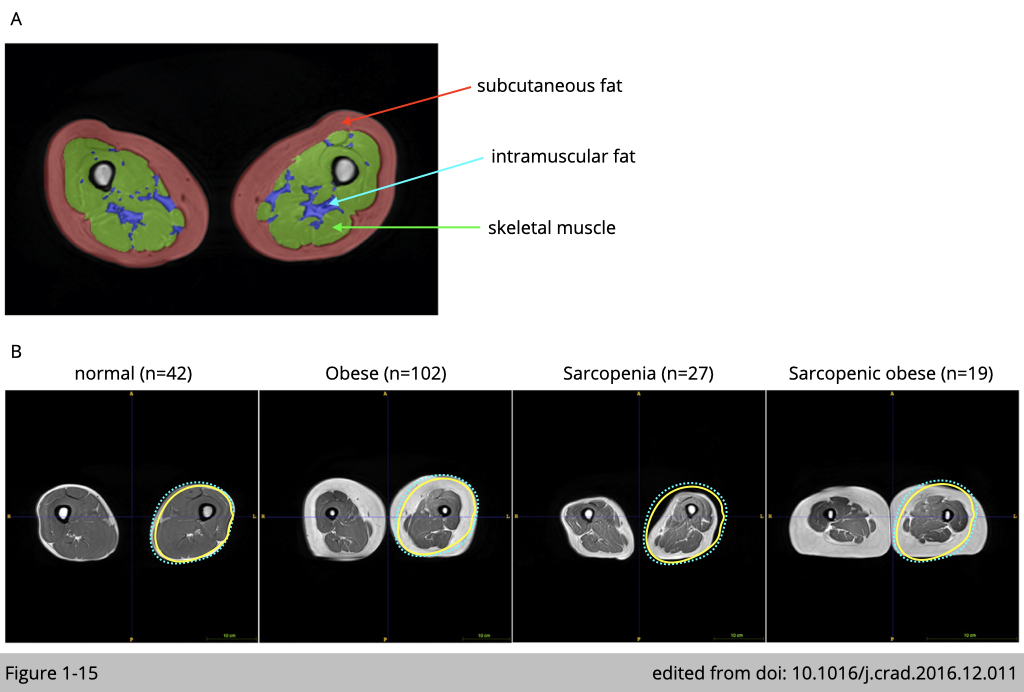
Change in body mass index (BMI) is evidently observed in humans during aging. Increased adiposity with age is positively associated with decreased muscle mass. In addition, the amount of intramuscular fat infiltrating muscle is positive associated with insulin resistance and chronic inflammation in skeletal muscle.
A study carried in Singapore recruited 190 community-swelling and cognitively normal elderly (age= 67.9±7.9 years, 58 males and 132 females) to examine skeletal muscle quality using magnetic resonance imaging (MRI) (Figure 1-15). They first diagnose sarcopenia and obesity by Asian Working Group for Sarcopenia criteria and the revised National Cholesterol Education Program (NCEP) obesity criteria using waist circumference (90 cm for Asian men and 80 cm for Asian women), respectively. MRI confirms the diagnosis of sarcopenia that the mean muscle volume from healthy elderly is 586.96±142.01 cm3/m2 versus sarcopenic elderly are 496.53±86.35 cm3/m2. The mean intramuscular fat volume from sarcopenia elderly are 19.40±7.83 cm3/m2 versus sarcopenic obese elderly are 32.65±18.75 cm3/m2.
Higher intramuscular fat infiltrating correlated with lower mobility function

The relevance of intramuscular fat and muscle weakness has been reported in many cross-sectional studies in the elderly. Intramuscular fat is now recognized as an independent risk factor for morbidity. A study recruited 12 females and 3 males with a mean age of 70.5 years (±10.6) and a body mass index of 28.3 (±6.6) in the USA examined the relationship of muscle strength, muscle mass, and intramuscular fat (Figure 1-16). The measurements of lean tissue and intramuscular adipose tissue (IMAT) composition of the thigh were performed using MRI. The central activation ratio (CAR) was measured by a voluntary isometric force effort preceded by a superimposed, electrically elicited (1000 µs pulses) force measurement. They reported that there is no correlation between muscle mass and muscle force production in the elderly. Yet, there is an invert correlation of IMAT and CAR observed in this cohort that elderly with higher intramuscular fat also has lower muscle force production.
In summary, sarcopenia development is contributed by internal factors- the declines in muscle mass and external factors- the changes in the muscle microenvironment, including reduced vascular supplies, increased intramuscular fat, etc. Sarcopenia is composed of multifactorial pathogenesis and is associated with multiple comorbidities in the elderly.
In the next lesson, we will discuss the clinical relevance of sarcopenia associates with other diseases in the elderly. We will also discuss the interventions to mitigate sarcopenia.

