Perceptions of the learning environment in ophthalmology residency training: A mixed method study

Submitted: 1 July 2023
Accepted: 24 October 2023
Published online: 2 April, TAPS 2024, 9(2), 39-50
https://doi.org/10.29060/TAPS.2024-9-2/OA3074
Muhammad Irfan Kamaruddin1,2, Andi Alfian Zainuddin1,3, Berti Nelwan1,4, Sri Asriyani1,5, Firdaus Hamid1,6, Tenri Esa1,7 & Irawan Yusuf1,8
1Department of Medical Education, Faculty of Medicine, Hasanuddin University, Indonesia; 2Department of Ophthalmology, Faculty of Medicine, Hasanuddin University, Indonesia; 3Department of Public Health, Faculty of Medicine, Hasanuddin University, Indonesia; 4Department of Pathology Anatomy, Faculty of Medicine, Hasanuddin University, Indonesia; 5Department of Radiology, Faculty of Medicine, Hasanuddin University, Indonesia; 6Department of Microbiology, Faculty of Medicine, Hasanuddin University, Indonesia; 7Department of Clinical Pathology, Faculty of Medicine, Hasanuddin University, Indonesia; 8Department of Physiology, Faculty of Medicine, Hasanuddin University, Indonesia
Abstract
Introduction: A good learning environment (LE) will affect the quality and standard of the learning process, student performance, and the outcome of the curriculum as well as predictor of the quality of health services. Our study aims to assess residents’ perception of the LE in Ophthalmology training programs for future improvement.
Methods: Mixed method with an explanatory sequential design was implemented in this study using the Post-graduate Hospital Educational Environment Measure (PHEEM) as a quantitative approach and open-ended questions collaborated with focus group discussion (FGD) as a qualitative measurement. A comparison of the quantitative data was made using parametric and non-parametric analyses. Thematic analyses were performed for qualitative data. Integration of quantitative and qualitative data was done by connecting both data.
Results: Fifty-three residents participated in this survey. The mean age was 30.96±2.18 years old, 64.15% were female and 77.36% are at the internship stage. The mean score of overall PHEEM was 123.40 ±12.35, indicated an excellent LE, while the mean score of perceptions of role autonomy, perceptions of teaching, and perceptions of social support were 42.57±4.62, 47.75±4.84 and 33.08±4.15, respectively. There is no significant difference between gender and study period with the perception of LE. Thematic analysis from qualitative data reveals six positive and five negative perception themes. All discovered themes confirmed concordance with the result of LE perception.
Conclusion: Learning environment perception in the ophthalmology residency program was excellent and essential for the student’s skills and performance quality. Some specific areas still need improvement strategies for institutional development.
Keywords: Learning Environment, PHEEM, Ophthalmology, Residency, Mixed Method
Practice Highlights
- Ophthalmology resident has an excellent learning environment.
- Good teacher, learning system and social life will give positive perception on learning environment.
- Lack of learning opportunity, less mentoring time, and suboptimum facilities influence students negative perception of learning environment.
I. INTRODUCTION
A good learning environment (LE) will affect the learning process and student behavior and determine the outcome of the curriculum (Al-Shiekh et al., 2014; Bari et al., 2018; Binsaleh et al., 2015; Ong et al., 2019; Ong et al., 2020). Learners who experience an excellent LE will actively participate in the learning process (Clapham et al., 2007). With an ideal LE, learners can achieve better academic success than learners who perceive the LE negatively (Ong et al., 2019; Ong et al., 2020).
The clinical LE is an essential factor influencing the quality of medical education in residency programs (Sandhu et al., 2018). The resident LE, which mostly took place at the hospital, differs from that of medical students. This environment has many destructive factors that impact residents’ performance and mentality and can result in residents experiencing symptoms of burnout (Prins et al., 2010; Ripp et al., 2017). Suboptimal clinical LE have been associated with poor patient care and learning outcomes (General Medical Council, 2016). Therefore, efforts to improve the quality of the LE not only positively impact the environment in which learners learn and participate in patient care but also affect the practice of graduate doctors in the future.
This study aims to determine the residents’ perception of LE in the ophthalmology training program. Based on current data, there is still no study about ophthalmology residents’ perception of LE and its associated factors. This study is a pioneer and pilot study of LE in Ophthalmology training programs, especially in Indonesia.
II. METHODS
A. Study Design and Subjects
This mixed methods study was conducted with explanatory sequential design with both quantitative and qualitative measurements that were performed from January to May 2023 at two main teaching hospitals for the ophthalmology specialist program (OSP) Faculty of Medicine, Hasanuddin University in Makassar, Indonesia.
The study consists of two phases; the first is an offline survey comprising The PHEEM questionnaire and open questions data collection. The second phase of the study was focus group discussion (FGD).
Total sampling was used to determine the sample for the study’s first phase. Our inclusion criteria for the first phase were ophthalmology residents who have experience training in both main teaching hospitals and have attended a minimum of 6 months of ophthalmology residency training. Sixty residents met the inclusion criterion, and seven were excluded because they could not participate in the offline survey due to personal reasons. Fifty-three residents were included in the first phase of the study.
On the other hand, purposive sampling was employed to decide on phase two study participants. The PHEEM score, open-ended questions responses, and representation for each year of residency training were used to ensure heterogeneity of participants for different perspectives. Residents with high and low PHEEM scores and with exciting and evoking responses to open-ended questions were selected as respondents while considering resident representation for each year of training. Twenty residents were included in phase 2 of the study. The residents were divided into two groups consisting of 10 residents to attend FGD.
B. Study Instruments and Procedure
A cross-sectional survey that included a paper based PHEEM questionnaire, open-ended questions, and sociodemographic data, including age, gender, and year of residency, was distributed to all study subjects. The survey was conducted by single-trained data collector which was not part of the study program. Before administration, the study background, including its purposes and potential impacts, was explained to the residents and the written consent of each resident was obtained. Resident confidentiality and anonymity were also guaranteed.
The PHEEM consists of 40 items regarding LE subdivided into three subscales, each assessing perception of role of autonomy, perceptions of teaching, and perceptions of social support. It is scored on a 5-point Likert scale ranging from “strongly disagree” (0) to “strongly agree” (4), with a maximum score of 160. The findings were interpreted according to the original study shown in Supplement Table 1 (Roff et al., 2005). Four negative questions (questions 7, 8, 11, 13) were scored in reverse. PHEEM has been validated to assess the post-graduate clinical learning environment after the original study, including after translation to different languages, including the Bahasa Indonesia version (Raharjanti & Ramadianto, 2016; Roff et al., 2005). Multiple subsequent studies have shown good internal reliability (Bari et al., 2018; Clapham et al., 2007; Ong et al., 2019). The Bahasa Indonesia version of the PHEEM questionnaire was used to suit the local context. Bahasa Indonesia version of the PHEEM Questionnaire shows good validity and reliability (Raharjanti & Ramadianto, 2016). Eight open questions were added to the questionnaire. The questions were related to 3 subscales on the PHEEM questionnaire. Validation of the open-ended questions was done by expert judgment from two experts.
A semi-structured focus group session was conducted among the selected group of residents to supplement the PHEEM results. Two FGD session was done with a group size of ten. The FGD questions focused on exploring supporting and barrier factors that influence a good LE. The session lasted 60-90 minutes and was guided by a single-trained facilitator experienced in qualitative research methodology. FGD was conducted until new insights were no longer attained, reaching saturation.
Both quantitative and qualitative demographic data were coded by the trained data collector for maintaining the anonymity of the data. The response from both anonymous data were stored securely by the author for further analyses.
C. Statistical Analyses
Quantitative data were analysed using IBM Statistical Package for Social Sciences (SPSS) version 25. Descriptive statistics were presented using percentages, means, and standard deviation (SD). Internal reliability was assessed using Cronbach’s alpha coefficient. Comparison of quantitative data was made using Independent T-Test, Mann–Whitney U-Test, One-way ANOVA, and Kruskal–Wallis H-test. A p-value <0.05 was considered statistically significant.
For qualitative analyses, transcriptions of the open-ended questions answers and the audio and video recording of FGD were made by an independent data collector, and its accuracy was confirmed by the first author and the FGD facilitator. For open-ended questions, participants were coded with “P(Participant Code)-OEQ” (e.g. participant 1:P1-OEQ) while for FGD participants were coded with “P(Participant Code)-FGD(Group)” (e.g. participant 1 in FGD 2: P1-FGD2). The transcripts were coded into common themes independently by two investigators and discussed using thematic analysis using QDA Miner Version 5.0 for open questions and MAXQDA Analytics Pro 2020 for FGD.
III. RESULTS
A. Quantitative Data
Fifty-three ophthalmology residents were included in this mixed-method study, with the majority being female (64.15%). The mean age of residents was 30.96±2.18 years old. The largest age group is aged 30-34 (67.93%). 77.36% of respondents are at the internship stage or in the year 1 to 3 period of study, where respondents in year 3 have the most significant number of residents (32.08%).
Internal reliability of the PHEEM score was good, with Cronbach’s alpha coefficient of 0.872. No significant change with the removal of any of the 40 questions, proving its good internal reliability. Data in the perception of the role of autonomy was not normally distributed (P<0.05), but in the perception of teaching (P=0.200), perception of social support (P=0.200), also overall PHEEM score (P=0.200), the data were distributed normally.
As shown in Table 1, the mean score (SD) of the overall PHEEM score was 123.40±12.35, which is categorised as an excellent learning environment (LE) (>120). The mean perceptions for each subscale were 42.57±4.62 for perceptions of the role of autonomy classified as “more positive than negative”; 47.75±4.84 for perceptions of teaching classified as “model teachers”; 33.08±4.15 for perceptions of social support classified as “more pros than cons.”
|
No |
PHEEM Subscales |
Mean (SD) |
Interpretation |
Maximum Score |
|
1 |
Perceptions of role of autonomy |
42.57±4.62 |
more positive than negative |
56 |
|
2 |
Perceptions of teaching |
47.75±4.84 |
model teachers |
60 |
|
3 |
Perceptions of social support |
33.08±4.15 |
more pros than cons |
44 |
|
4 |
Overall PHEEM |
123.40±12.35 |
Excellent |
160 |
Table 1. The PHEEM scores
Abbreviation: PHEEM, Postgraduate Hospital Environment Measure; SD, Standard Deviation.
From the overall PHEEM item, there are 28 items with an average score >3, nine items in the perception of the role of autonomy, twelve items in teaching perception, and seven items in the perception of social support (Table 2). Only one item has a score >3.5 or is classified as real positive points; that is item number 3 (I have protected educational time in this post) for the perception of teaching. The highest score for the perception of the role of autonomy was item 34 (The training in this post makes me feel ready to be a consultant) and item 24 (I feel physically safe within the hospital environment) in the perception of social support.
Only one item with an average score of <2, indicated as a problem area which is item number 26 (There are adequate catering facilities when I am on call) in the perception of social support (Table 2). In the perception of the role of autonomy, item 8 (I must perform inappropriate tasks*) have the lowest score, while item 31 (My clinical teachers are accessible) has the lowest score under the perception of teaching (Table 2).
|
Code |
Item |
Mean±SD |
|
|
Perception of role of autonomy |
|||
|
34 |
The training in this post makes me feel ready to be a consultant |
3.40±0.53 |
|
|
40 |
My clinical teachers promote an atmosphere of mutual respect |
3.34±0.48 |
|
|
30 |
I have opportunities to acquire the appropriate practical procedures for my residency |
3.32±0.51 |
|
|
29 |
I feel part of a team working here |
3.21±0.49 |
|
|
5 |
I have the appropriate level of responsibility in this post |
3.19±0.56 |
|
|
18 |
I have the opportunity to provide continuity of care |
3.19±0.44 |
|
|
1 |
I have an employment contract that provides information about hours of work |
3.15±0.72 |
|
|
32 |
My workload in this job is fine |
3.02±0.50 |
|
|
4 |
I had an informative induction program |
3.00±0.59 |
|
|
14 |
There are clear clinical protocols in this post |
2.98±0.64 |
|
|
17 |
My work hours are in accordance to the national limits of working hours per day and week for physicians |
2.74±0.79 |
|
|
9 |
There is an informative Junior Doctors Handbook |
2.70±0.72 |
|
|
11* |
I am bleeped (called) inappropriately* |
2.68±0.89 |
|
|
8* |
I have to perform inappropriate tasks* |
2.66±0.88 |
|
|
Perception of teaching |
|||
|
3 |
I have protected educational time in this post |
3.51±0.58 |
|
|
2 |
My clinical teachers set clear expectation |
3.47±0.54 |
|
|
37 |
My clinical teachers encourage me to be an independent learner |
3.40±0.49 |
|
|
28 |
My clinical teachers have good teaching skills |
3.38±0.49 |
|
|
12 |
I am able to participate actively in educational events |
3.28±0.53 |
|
|
10 |
My clinical teachers have good communication skills |
3.25±0.55 |
|
|
27 |
I have enough clinical learning opportunities for my needs |
3.23±0.42 |
|
|
15 |
My clinical teachers are enthusiastic |
3.15±0.57 |
|
|
21 |
There is access to an educational program relevant to my needs |
3.15±0.53 |
|
|
23 |
My clinical teachers are well organised |
3.15±0.53 |
|
|
6 |
I have good clinical supervision at all times |
3.06±0.66 |
|
|
33 |
Senior staff utilise learning opportunities effectively |
3.06±0.41 |
|
|
39 |
The clinical teachers provide me with good feedback on my strengths and weaknesses |
2.98±0.57 |
|
|
22 |
I get regular feedback from seniors |
2.92±0.70 |
|
|
31 |
My clinical teachers are accessible |
2.77±0.61 |
|
|
Perception of Social Support |
|
||
|
24 |
I feel physically safe within the hospital environment |
3.36±0.59 |
|
|
13* |
There is sex discrimination in this post* |
3.30±0.99 |
|
|
7* |
There is racism in this post* |
3.28±0.84 |
|
|
35 |
My clinical teachers have good mentoring skills |
3.28±0.53 |
|
|
16 |
I have good collaboration with other doctors in my residency |
3.25±0.52 |
|
|
36 |
I get a lot of enjoyment out of my present job |
3.15±0.53 |
|
|
20 |
This hospital has good quality accommodation for junior doctors, especially when on call |
3.04±0.71 |
|
|
38 |
There are good counselling opportunities for junior doctors who fail to complete their training satisfactorily |
2.98±0.66 |
|
|
19 |
I have suitable access to careers advice |
2.94±0.66 |
|
|
25 |
There is a no-blame culture in this post |
2.53±0.93 |
|
|
26 |
There are adequate catering facilities when I am on call |
1.96±1.02 |
|
Table 2. Mean score in each item on the PHEEM questionnaire
Notes: Ordered by highest score in each subscale; *negative statement.
Abbreviation: SD, Standard Deviation.
In Table 3, an analysis of the relationship between student perception and gender from total PHEEM score showed no significant difference (P= 0.863). The mean scores of females were higher than males for the perception of teaching and social support, although not significantly different (P= 0.209 & P= 0.869). Conversely, in the perception of autonomy, the mean scores of females were lower than males but also not statistically significant (P= 0.212). The biggest difference between male and female perceptions is the perception of teaching.
|
Sample’s Characteristics |
Total PHEEM Scores |
Perception of Role of Autonomy |
Perception of Teaching |
Perception of Social Support |
|||||||
|
Mean±SD |
p |
Mean±SD |
p |
Mean±SD |
p |
Mean±SD |
p |
|
|||
|
Gender |
|
|
|
|
|
|
|
|
|
||
|
Male |
123.00±13.24 |
0.863a |
43.42±5.00 |
0.212b |
46.63±5.20 |
0.209a |
32.95±4.44 |
0.869a |
|
||
|
Female |
123.62±12.03) |
42.09±4.40 |
48.38±4.58 |
33.15±4.05 |
|
||||||
|
Years of Study |
|
||||||||||
|
Year 1 |
123.9±9.39 |
0.273c |
42.40±4.40 |
0.163d |
48.40±3.60 |
0.363c |
33.10±2.81 |
0.444c |
|
||
|
Year 2 |
126.2±12.49 |
43.57±5.32 |
48.43±4.89 |
34.21±3.49 |
|
||||||
|
Year 3 |
122.7±13.87 |
42.65±4.24 |
47.71±5.52 |
32.35±5.50 |
|
||||||
|
Year 4 |
115.7±6.14 |
39.50±2.56 |
44.75±3.28 |
31.50±1.85 |
|
||||||
|
Year 5 or more |
130.50±18.08 |
45.25±6.24 |
50.00±6.38 |
35.25±5.62 |
|
||||||
Table 3. Correlation between sample’s characteristics and perception
Abbreviation: PHEEM, Postgraduate Hospital Environment Measure; SD, Standard Deviation.
aindependent sample t-test; bMann-Whitney test; cOne Way ANOVA test; dKruskall-Wallis test
No significant differences were found for a mean of total PHEEM scores among years of the study group (P= 0.273), as well as in perceptions of the role of autonomy (P= 0.163), perceptions of teaching (P= 0.363) and perceptions of social support (P= 0.444). However, there are similar trends in both total PHEEM scores and perceptions of autonomy, teaching, and social support, in which the score of year 2 was higher than that of year 1, the lowest score in the year four student group, and the highest score in the 5th year student group or above.
The data supporting the quantitative findings of this study are openly available in Figshare at https://doi.org/10.6084/m9.figshare.23606157 (Kamaruddin et al., 2023).
B. Qualitative Data
Six open-ended questions were administered along with the PHEEM questionnaire. Thematic analyses revealed 12 themes in which residents have a positive perception of their LE and 10 themes that could be a barrier because residents have a negative perception of their LE (Appendix 1). Two FGDs were conducted with 10 participants in each group. Eleven participants were from year one and two, and the rest was from year three or more. Eight males and 12 females participated. From FGD results, we could also classify residents’ perceptions into 8 positive and 11 negative perception themes (Appendix 1).
Based on the themes found in both open-ended questions and FGD, we transform and formulate the final theme by connecting and merging themes that occurred from both methods. The final theme’s transformation and formulation are presented in Appendix 1. Even though the number of themes was not significantly different from positive and negative perceptions, we can see from the data transformation (based on % code and count) that the propensity of the theme was towards the positive perception.
There is a total of 11 final themes, of which six themes were positive and five were negative perceptions.
The themes along with supporting statements are as follows:
|
Positive perception themes |
Supporting Statements |
|
1. A good clinical teacher |
“Clinical teachers in Ophthalmology Study Program are very competent, highly dedicated, and respect us as students.” – P52-OEQ |
|
2. Conducive learning atmosphere |
“The learning atmosphere is very conducive.” – P6-FGD1 |
|
3. Well-organised learning system |
“The schedule is in order; everything has been arranged, so it all depends on whether residents want to finish on time or not.” – P6-FGD2 |
|
4. Friendly social environment |
“I feel that the working environment or colleagues here are very good; the sense of family is felt even though I am not originally from this city.” – P29-OEQ |
|
5. Supporting colleague |
“Everything was safe here, delightful; we support each other.” – P5-FGD1 |
|
6. Well-established facilities |
“The facilities is good, all equipment is available and easy to access in the hospital.” – P15-OEQ |
|
Negative perception themes |
Supporting Statements |
|
1. Suboptimal facilities |
“Things that still need improvement are the facilities and infrastructure; the study program should be provided special rooms such as study rooms with libraries and computers to support us to complete our tasks.” – P50-OEQ |
|
2. Inadequate learning opportunities (discrimination issue) |
“There are still teachers who seem to discriminate between residents.” – P46-OEQ |
|
3. Inappropriate tasks |
“all administrative tasks be imposed on the resident, and everything must be sorted out in our hands; the nurse is just left to take care of everything that has been done.” – P8-FGD2 |
|
4. Less mentoring time |
“What is lacking is the supervisor’s time to provide mentoring; there are still several clinical teachers who lack time to provide discussion, and there are even some who directly accept the scientific task without going through discussion.” – P3-FGD2 |
|
5. Lack of teaching hospitals/clinics |
“Maybe there can be an additional teaching hospital or clinic in Makassar.” – P10-FGD2 |
Table 4. Supporting statements of themes
C. Quantitative and Qualitative Data Integration
The integration of quantitative and qualitative data can be shown in Figure 1 and Supplement Table 2. Overall, the mean total PHEEM scores (123.40±12.35), which indicated an excellent LE environment, were confirmed by more positive perception themes compared with negative perception found in qualitative data analyses (Figure 1). Besides, we could also see that in each subscale, the composition of the themes connecting to each subscale could confirm the results of the quantitative data, whether the trend of the graphs is primarily high, average, or low. For example, in the perception of teaching, we could see mostly positive perception themes were connected to the subscale rather than negative perception; from this, we could say that the quantitative data of the perception of teaching in which mostly classified as model’s teacher was confirmed by its connection towards the final themes.
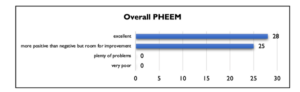
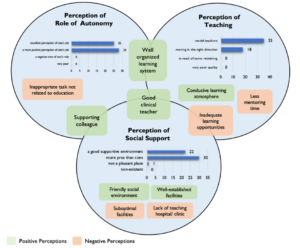
Figure 1. Integration of overall quantitative data classification with qualitative data
Quantitative data represent by graph and qualitative data (positive and negative perceptions) represent by box. Perceptions in the circle area means that it was connected to the area. Overlapping box in the circle means that perception was connected to more than one area.
In each subscale, the high and low items’ scores were confirmed with the final themes, both for positive and negative perception (Supplement Table 2). All positive perceptions confirmed quantitative results by related with a minimum of one item from 3 subscales with mostly high mean scores (>3). Only three negative perceptions related to a minimum of one item from 3 subscales with low scores (<3) confirm these themes’ relation to quantitative results. One negative perception (Inadequate learning opportunities among residents/discrimination issue) is connected to an item with high scores, showing that this theme did not confirm the quantitative finding. Two themes appear contradictory in positive and negative perceptions (well-established facilities and suboptimum facilities). Both themes were related to the same item in which the scores were not high or low, which could confirm the possibility from both perspectives.
IV. DISCUSSION
Our finding shows an excellent perception of LE of ophthalmology residents. Based on previously published articles, this study has the highest score for overall scores and for each subscale among peer-reviewed publications of PHEEM studies worldwide. The highest score from a previous peer-reviewed publication was a study by Ong et al. (2020), which reported a more positive than negative internal medicine residents’ perceptions of their LE in Singapore. On the contrary, Fisseha et al. (2021) and Liaqat et al. (2019) reported a plenty of problems LE from the perception of internal medicine residents in Ethiopia and pediatric surgery residents’ perception in Iran, respectively. Many factors, such as differences in discipline and sites of training, could cause the differences. There is no previous study yet about ophthalmic residents’ perception of LE using PHEEM. However, it is previously proved that some studies evaluated several different training programs reported that there is a difference in overall and subscale PHEEM scores among various training programs (Chan et al., 2016). In line with discipline, studies that evaluated different sites of training mainly reported that there is a different score between sites of training (Chan et al., 2016). Another reason for the difference could be a result of the differences in curriculum and teaching methods. Some studies reported increasing perception of LE after implementing modern curriculum and student-centred learning (Brown et al., 2011; Shankar et al., 2014). The themes found from our qualitative study also supported this excellent perception of residents toward their LE. Most of our themes were positive and related to all aspects of the PHEEM questionnaire. Gruppen et al. (2019) reported a conceptual framework of LE in which all components of the framework, i.e., personal, social, physical, and organisational, supported and covered by our positive perception themes finding, confirming the excellent perception of LE from the residents.
We did not find any different perceptions of LE between gender and year of study. Our findings were similar to some studies that reported no gender differences (Al-Shiekh et al., 2014; Ong et al., 2020; Sandhu et al., 2018). Other studies have different results; some studies reported that males have a better perception than females (Fisseha et al., 2021; Gough et al., 2010); on the contrary, Liaqat et al. (2019) reported a better perception of females than males. Similar to Risberg et al. (2003) that reported, gender issues were more significant and essential during clinical consultation than tutoring. Our qualitative data did not confirm our quantitative results. There is one negative perception theme in which some of our students feel that there is a discrimination issue related to learning opportunities; one of them is gender discrimination. Although our quantitative data show no differences between gender, the negative perception theme regarding discrimination issues must be taken into account by the stakeholder.
Concerning the year of training, we also found no significant difference in perception. The finding regarding different perceptions for different years of training was varied. Our result was the same with some studies (Ong et al., 2019; Sandhu et al., 2018), but other studies also reported higher PHEEM scores for senior to junior (Gough et al., 2010; Khoja, 2015; Liaqat et al., 2019; Pinnock et al., 2009), and some studies also reported that junior has better score than senior (Fisseha et al., 2021; Mahendran et al., 2013). The differences in perception of junior and senior residents could be explained by some reason, such as available access to educational opportunities (Mahendran et al., 2013), greater responsibility with increased seniority (Pinnock et al., 2009), and different training locations for trainees of different seniority (Khoja, 2015).
All subscales show promising results; residents’ perception of teaching was the highest among other subscales. Our qualitative data also support this finding; most of our positive theme was related to the perception of teaching, one of them being a good clinical teacher. Despite good perceptions on teaching, residents also experienced less mentoring time with clinical teachers. Fisseha et al. (2021) also reported the same issue. Inadequate supervision was proved to be a barrier in post-graduate medical education, as reported by Talib et al. (2019). Ong et al. (2019) also reported that focus group data suggested that inadequate supervisor contact and feedback resulted in negative perceptions of the LE. This finding informs us that residents need appropriate supervision, and clinical teachers should be understanding and prepared for their roles in residency training programs (Ramani & Leinster, 2008). Increasing learning time without any addition to supervisor-resident contact time still results in a low perception of LE (Silkens et al., 2018), proving the importance of the supervisor-resident relationship. Besides, good supervisory strategies proved to be contributed to a good LE (Boor, 2009). A good teaching environment influences the standard of the learning process (Al-Shiekh et al., 2014; Bari et al., 2018), satisfaction with education, and determines the outcome of the curriculum (Bari et al., 2018; Binsaleh et al., 2015). Faculty should focus on developing adequate supervision and teaching skills programs for clinical teachers.
Perception of social support has the lowest score among other; it is affirmed by our qualitative finding in which three negative perception was connected to this subscale. Similar results were also reported from studies in intensive care and pediatric training program (Al-Shiekh et al., 2014; Clapham et al., 2007). Related to social support, catering facilities is problem area of this study, other studies also identified this issue as a problem (Al-Shiekh et al., 2014; Binsaleh et al., 2015; Fisseha et al., 2021; Ong et al., 2020). This finding was not specifically appeared on FGD, but the strategy to solve the problem should be considered. Another interesting result related to social support is about facilities. The topic has both perspectives, positive and negative. Quantitative item related to this finding was not had very high or very low scores, supporting that some facilities were good, but there is still area for improvement, especially for diagnostic tools and surgical training facilities, as stated in FGD. Other studies also reported that suboptimal facilities related to hospital diagnostic tools were also a barrier to achieving good LE (Fisseha et al., 2021; Talib et al., 2019). Schönrock-Adema et al. (2012) have highlighted that interaction and collaboration with others were significant in determining the LE. Faculty should pay attention to social support as it has a vital role in a residency program, as it could alleviate the effects of stress, depression, and burnout (Vieira, 2008). Strategy to escalate this area should be considered, especially in providing good facilities for the learning process.
Residents’ perception of the role of autonomy is also satisfying, most of the positive themes confirmed this subscale. Good autonomy can improve decision-making skills, self-confidence, and responsibility, which further influence the readiness of residents to be independent (Allen et al., 2019). It also improves work satisfaction and can reduce burnout (Allen et al., 2019). Although overall autonomy perception was good, there are some areas for improvement. Our finding shows that residents were imposed with inappropriate tasks, such as administrative tasks. Some activities not related to education are also obligated to the residents at a certain level of training. This condition could lead to an excessive, inappropriate workload and interfere with protected educational time. Therefore, the faculty should set precise regulations regarding job descriptions and accountability.
Our study was done in the main teaching hospital which was part of a university-based study program, the results could be benefit for other hospital with same basis. It shows that university-based program has a good teaching area especially for the curriculum and teaching resources including human resources and facilities. University-based teaching hospital could enhance their program by maximising their teaching area also paying attention to some factors that could be a barrier in university-based program such as learning opportunity and inappropriate task.
A mixed method with explanatory sequential design is fundamental in our study as it provides a comprehensive perception of residents. Qualitative data make our finding more solid, show us some weaknesses, and emphasise our areas for improvement which are not easily identified from quantitative analyses. This is also a pioneer study for ophthalmology residents’ perception of LE, making our finding also crucial in adding insight to understanding residency LE from multiple perspectives. On the other hand, several limitations were also identified. First, our study was only done in one centre and discipline, which may limit data generalisability. Second, the study time constraint was cross-sectional, so the causative relation between factors could not be established. Third, differences perceptions in each different training year cannot be ascertained because there can be information bias related to the perceptions of second-year students and so on towards their experiences in previous years. Fourth, the researcher is a clinical lecturer from the program who conducted the study, which could be the subject of bias. However, a single trained data collector was used to collect open-ended questions data and facilitate FGD to reduce the possible bias effect.
V. CONCLUSION
In conclusion, our finding shows that our resident has an excellent perception of their ophthalmology residency training. The program has strong areas such as a good clinical teacher, a well-organised learning system, and a good social environment. Several areas should pay attention to, especially equal learning opportunities, mentoring time, and facilities. Faculty should organise strategies for preserving current LE and to further improve the LE along with monitoring and evaluation. Our finding could be benefit for other university-based teaching hospital especially in Asia regions to enhance their program. Further study involving multiple centres and disciplines should be done to give a more general perspective of LE in residency training.
Notes on Contributors
Muhammad Irfan Kamaruddin involved in conception or design of the work, data collection, data analysis and interpretation, drafting the article, critical revision of the article, and final approval of the version to be published.
Andi Alfian Zainuddin involved in conception or design of the work, data analysis and interpretation, critical revision of the article, and final approval of the version to be published.
Berti Julian Nelwan involved in conception or design of the work, critical revision of the article, and final approval of the version to be published.
Sri Asriyani involved in conception or design of the work, critical revision of the article, and final approval of the version to be published.
Firdaus Hamid involved in conception or design of the work, critical revision of the article, and final approval of the version to be published.
Tenri Esa involved in conception or design of the work, critical revision of the article, and final approval of the version to be published.
Irawan Yusuf involved in conception or design of the work, critical revision of the article, and final approval of the version to be published.
Ethical Approval
Before conducting the research, permission was obtained from Faculty of Medicine, Hasanuddin University Institutional Review Board (Reference number 36/UN4.6.4.5.31/PP36/2023). Participants were informed of the objectives and purpose of the study. They were invited to sign an informed consent if they agreed to be part of the study. Every participant was given a chance to deliberate on their rights to participate, refuse, or withdraw at any time they wished to do so.
Data Availability
The authors confirm that the data supporting the findings of this study are available within the article and its quantitative data along with supplemental tables are openly available in Figshare repository https://doi.org/10.6084/m9.figshare.23606157. Representative qualitative data translated into English are shown in the Result section (Kamaruddin et al., 2023). All qualitative data, open questions, and the FGD protocol which all written in Bahasa, are available from the corresponding author on reasonable request.
Acknowledgement
The authors would like to express our sincere gratitude to Ichlas Nanang Affandi from the Psychology study program, Faculty of Medicine, Hasanuddin University, for his valuable support throughout the research process. His expertise in qualitative study helps us to overcome challenges. In particular, we would like to thank Natalia Widiasih Raharjanti, MD, from the Department of Psychiatry, Faculty of Medicine University of Indonesia, and Assistant Professor Henok Fisseha, MD, from the Department of Internal Medicine, St. Paul’s Hospital Millennium Medical College, Addis Ababa, Ethiopia for their support in allowing us to use their research instrument and study protocol as one of our references in our research. Thank you also to Rusdina Bte Ladju, MD, Ph.D., for her valuable input to our manuscript. We are also grateful to the Department of Medical Education, Faculty of Medicine, Hasanuddin University, and Department of Ophthalmology, Faculty of Medicine, Hasanuddin University, for providing us with the resources and support needed to complete this study.
Funding
None of the authors receive any financial support for this study.
Declaration of Interest
The authors did not have a conflict of interest to be declared in this study.
References
Allen, M., Gawad, N., Park, L., & Raîche, I. (2019). The educational role of autonomy in medical training: A scoping review. Journal of Surgical Research, 240, 1–16. https://doi.org/10.1016/j.jss.2019.02.034
Al-Shiekh, M. H., Ismail, M. H., & Al-Khater, S. A. (2014). Validation of the postgraduate hospital educational environment measure at a Saudi university medical school. Saudi Medical Journal, 35(7), 734–738.
Bari, A., Khan, R. A., & Rathore, A. W. (2018). Postgraduate residents’ perception of the clinical learning environment; use of postgraduate hospital educational environment measure (PHEEM) in Pakistani context. The Journal of the Pakistan Medical Association, 68(3), 417–422.
Binsaleh, S., Babaeer, A., Alkhayal, A., & Madbouly, K. (2015). Evaluation of the learning environment of urology residency training using the postgraduate hospital educational environment measure inventory. Advances in Medical Education and Practice, 6, 271–277. https://doi.org/10.2147/AMEP.S81133
Boor, K. B. (2009). The clinical learning climate. [PhD-Thesis – Research external, graduation internal, S.I.]. s.n. https://research.vu.nl/en/publications/the-clinical-learning-climate
Brown, T., Williams, B., & Lynch, M. (2011). The Australian DREEM: Evaluating student perceptions of academic learning environments within eight health science courses. International Journal of Medical Education, 2, 94–101. https://doi.org/10.5116/ ijme.4e66.1b37
Chan, C. Y. W., Sum, M. Y., Lim, W. S., Chew, N. W. M., Samarasekera, D. D., & Sim, K. (2016). Adoption and correlates of postgraduate hospital educational environment measure (PHEEM) in the evaluation of learning environments – A systematic review. Medical Teacher, 38(12), 1248–1255. https://doi.org/10.1080/0142159X.2016.1210108
Clapham, M., Wall, D., & Batchelor, A. (2007). Educational environment in intensive care medicine—use of postgraduate hospital educational environment measure (PHEEM). Medical Teacher, 29(6), e184–e191. https://doi.org/10.1080/01421590701288580
Fisseha, H., Mulugeta, B., Argaw, A. M., & Kassu, R. A. (2021). Internal medicine residents’ perceptions of the learning environment of a residency training program in ethiopia: A mixed methods study. Advances in Medical Education and Practice, 12, 1175–1183. https://doi.org/10.2147/AMEP.S335205
General Medical Council. (2016). The state of medical education and practice in the UK. London (UK): General Medical Council. https://www.gmc-uk.org//media/documents/SOMEP_2016_Full_ Report_Lo_Res.pdf_68139324.pdf
Gough, J., Bullen, M., & Donath, S. (2010). PHEEM “Downunder.” Medical Teacher, 32(2), 161–163. https://doi.org/10.3109/01421590903509036
Gruppen, L. D., Irby, D. M., Durning, S. J., & Maggio, L. A. (2019). Conceptualizing learning environments in the health professions. Academic Medicine, 94(7), 969–974. https://doi.org/10.1097/ACM.0000000000002702
Kamaruddin, M. I., Zainuddin, A. A., Nelwan, B., Asriyani, S., Hamid, F., Esa, T., & Yusuf, I. (2023). Perceptions of the learning environment in ophthalmology residency training: A mixed method study [Data set]. Figshare.https://doi.org/10.6084/m9.figshare.23606157
Khoja, A. (2015). Evaluation of the educational environment of the Saudi family medicine residency training program. Journal of Family and Community Medicine, 22(1), 49. https://doi.org/10.4103/2230-8229.149591
Liaqat, N., Iqbal, A., & Dar, S. H. (2019). Assessment of environment of pediatric surgery residents of Pakistan using PHEEM. Iranian Journal of Pediatric Surgery, 5(1), 11–20. https://doi.org/10.22037/irjps.v5i1.22773
Mahendran, R., Broekman, B., Wong, J. C. M., Lai, Y. M., & Kua, E. H. (2013). The educational environment: Comparisons of the British and American postgraduate psychiatry training programmes in an Asian setting. Medical Teacher, 35(11), 959–961. https://doi.org/10.3109/0142159X.2013.815707
Ong, A., Fong, W., Chan, A., Phua, G., & Tham, C. (2020). Evaluating the educational environment in a residency programme in Singapore: can we help reduce burnout rates? Singapore Medical Journal, 61(9), 476–482. https://doi.org/10.11622/smedj.2019094
Ong, A. M.-L., Fong, W. W.-S., Chan, A. K.-W., Phua, G.-C., & Tham, C.-K. (2019). Using the postgraduate hospital educational environment measure to identify areas for improvement in a Singaporean residency program. Journal of Graduate Medical Education, 11(4s), 73–78. https://doi.org/10.4300/JGME-D-19-00234
Pinnock, R., Reed, P., & Wright, M. (2009). The learning environment of paediatric trainees in New Zealand. Journal of Paediatrics and Child Health, 45(9), 529–534. https://doi.org/10.1111/j.1440-1754.2009.01553.x
Prins, J. T., Hoekstra-Weebers, J. E. H. M., Gazendam-Donofrio, S. M., Dillingh, G. S., Bakker, A. B., Huisman, M., Jacobs, B., & van der Heijden, F. M. M. A. (2010). Burnout and engagement among resident doctors in the Netherlands: a national study. Medical Education, 44(3), 236–247. https://doi.org/10.1111/j.1365-2923.2009.03590.x
Raharjanti, N. W., & Ramadianto, A. S. (2016). Validity and reliability od postgraduate hospital educational environment measure – bahasa indonesia version. Jurnal Pendidikan Kedokte- ran Indonesia: The Indonesian Journal of Medical Educa- tion, 5(3), 157. https://doi.org/10.22146/jpki.25375
Ramani, S., & Leinster, S. (2008). AMEE Guide no. 34: Teaching in the clinical environment. Medical Teacher, 30(4), 347–364. https://doi.org/10.1080/01421590802061613
Ripp, J. A., Privitera, M. R., West, C. P., Leiter, R., Logio, L., Shapiro, J., & Bazari, H. (2017). Well-being in graduate medical education: A call for action. Academic Medicine, 92(7), 914–917. https://doi.org/10.1097/ACM.0000000000001735
Risberg, G., Johansson, E. E., Westman, G., & Hamberg, K. (2003). Gender in medicine – An issue for women only? A survey of physician teachers’ gender attitudes. International Journal for Equity in Health, 2(1), Article 10. https://doi.org/10.1186/1475-9276-2-10
Roff, S., McAleer, S., & Skinner, A. (2005). Development and validation of an instrument to measure the postgraduate clinical learning and teaching educational environment for hospital-based junior doctors in the UK. Medical Teacher, 27(4), 326–331. https://doi.org/10.1080/01421590500150874
Sandhu, A., Liaqat, N., Waheed, K., Ejaz, S., Khanum, A., Butt, A., Randhawa, F. A., & Dar, S. H. (2018). Evaluation of educational environment for postgraduate residents using Post Graduate Hospital Educational Environment Measure. The Journal of the Pakistan Medical Association, 68(5), 790–792.
Schönrock-Adema, J., Bouwkamp-Timmer, T., van Hell, E. A., & Cohen-Schotanus, J. (2012). Key elements in assessing the educational environment: Where is the theory? Advances in Health Sciences Education, 17(5), 727–742. https://doi.org/10.1007/s10459-011-9346-8
Shankar, P. R., Balasubramanium, R., Dwivedi, N. R., & Nuguri, V. (2014). Student feedback about the integrated curriculum in a Caribbean medical school. Journal of Educational Evaluation for Health Professions, 11, 23. https://doi.org/10.3352/jeehp.2014.11.23
Silkens, M. E. W. M., Chahine, S., Lombarts, K. M. J. M. H., & Arah, O. A. (2018). From good to excellent: Improving clinical departments’ learning climate in residency training. Medical Teacher, 40(3), 237–243. https://doi.org/10.1080/0142159X.2017.1398821
Talib, Z., Narayan, L., & Harrod, T. (2019). Postgraduate medical education in Sub-saharan Africa: A scoping review spanning 26 years and lessons learned. Journal of Graduate Medical Education, 11(4s), 34–46. https://doi.org/10.4300/JGME-D-19-00170
Vieira, J. E. (2008). The postgraduate hospital educational environment measure (PHEEM) questionnaire identifies quality of instruction as a key factor predicting academic achievement. Clinics, 63(6), 741–746. https://doi.org/10.1590/S1807-59322008000600006
*Muhammad Irfan Kamaruddin
Department of Medical Education,
Faculty of Medicine, Hasanuddin University,
Jalan Perintis Kemerdekaan KM 10
Makassar 90245
Email: iphenk_tampo@yahoo.com
Announcements
- Best Reviewer Awards 2025
TAPS would like to express gratitude and thanks to an extraordinary group of reviewers who are awarded the Best Reviewer Awards for 2025.
Refer here for the list of recipients. - Most Accessed Article 2025
The Most Accessed Article of 2025 goes to Analyses of self-care agency and mindset: A pilot study on Malaysian undergraduate medical students.
Congratulations, Dr Reshma Mohamed Ansari and co-authors! - Best Article Award 2025
The Best Article Award of 2025 goes to From disparity to inclusivity: Narrative review of strategies in medical education to bridge gender inequality.
Congratulations, Dr Han Ting Jillian Yeo and co-authors! - Best Reviewer Awards 2024
TAPS would like to express gratitude and thanks to an extraordinary group of reviewers who are awarded the Best Reviewer Awards for 2024.
Refer here for the list of recipients. - Most Accessed Article 2024
The Most Accessed Article of 2024 goes to Persons with Disabilities (PWD) as patient educators: Effects on medical student attitudes.
Congratulations, Dr Vivien Lee and co-authors! - Best Article Award 2024
The Best Article Award of 2024 goes to Achieving Competency for Year 1 Doctors in Singapore: Comparing Night Float or Traditional Call.
Congratulations, Dr Tan Mae Yue and co-authors! - Best Reviewer Awards 2023
TAPS would like to express gratitude and thanks to an extraordinary group of reviewers who are awarded the Best Reviewer Awards for 2023.
Refer here for the list of recipients. - Most Accessed Article 2023
The Most Accessed Article of 2023 goes to Small, sustainable, steps to success as a scholar in Health Professions Education – Micro (macro and meta) matters.
Congratulations, A/Prof Goh Poh-Sun & Dr Elisabeth Schlegel! - Best Article Award 2023
The Best Article Award of 2023 goes to Increasing the value of Community-Based Education through Interprofessional Education.
Congratulations, Dr Tri Nur Kristina and co-authors! - Best Reviewer Awards 2022
TAPS would like to express gratitude and thanks to an extraordinary group of reviewers who are awarded the Best Reviewer Awards for 2022.
Refer here for the list of recipients. - Most Accessed Article 2022
The Most Accessed Article of 2022 goes to An urgent need to teach complexity science to health science students.
Congratulations, Dr Bhuvan KC and Dr Ravi Shankar. - Best Article Award 2022
The Best Article Award of 2022 goes to From clinician to educator: A scoping review of professional identity and the influence of impostor phenomenon.
Congratulations, Ms Freeman and co-authors.
